Transformation

The time we went to SEAcon

What is the latest thinking being shared at Agile conferences? The Agile Coaches at ASOS took a day out at SEAcon — The Study of Enterprise Agility conference to find out more…

A joint article by myself, Dan and Esha, fellow Agile Coaches here at ASOS Tech.

What is SEAcon?

According to the website, it first started in 2017, with the organisers creating the first-ever enterprise agility related meetup (SEAm) and conference (SEAcon) as they wanted to support organisations’ desires to be driven by an authentic purpose. Having attended the 2020 version of the conference and hearing some great talks, we knew it was a good one to go check out, our first time doing this as a team of coaches at ASOS.

This year, the conference had over 30 speakers across three different tracks — Enterprise, Start-up/Scale-up and Agile Leadership. This meant that there was going to be a good range of both established and new speakers covering a variety of topics. A particular highlight was the Agile Leadership track which had a number of speakers outside of software development but with plenty of applicable learnings, which was refreshing.

The conference itself

Morning

The conference was hosted at the Oval Cricket Ground, which was a fantastic venue!

We started the day by attending Steve Williams’ How to win an Olympic Gold Medal: The Agile rowing boatsession. This talk was so good and it set a high bar for all the sessions to follow that day. What was great about it was not only Steve's passion but the fact that there were so many parallels with what teams and organisations are trying to do with employing agility. One of our favourites was the concept of a ‘hot wash up’. Here the rowers would debrief after an exercise on how it went and share feedback amongst each other, all overseen/facilitated by the coach. Not just any coach mind you, this was with Jürgen Gröbler, one of the most successful Olympic coaches ever with 13 consecutive Olympic Gold medals.

Interestingly, Steve shared that Jürgen did not have the build of nor was ever a rower himself, which, when you consider the seemingly endless debate around ‘should Agile Coaches be technical?’ offers an alternative thought in our world. Another great snippet was that in a rowing team of four, work is always split evenly; shared effort and no heroes. There is also no expectation to operate at 100% effort all the time as you can’t be ‘sprinting’ constantly (looking at you Scrum 👀).

Late morning and lunch

After the morning break, we reconvened and chose to check out Andrew Husak (Emergn) and his session on It’s not the people, it’s the system. We found this session very closely aligned with what we are looking at currently. It effectively covered how to measure the impact from the work you are doing is having in the organisation, with Andrew offering a nice blend of historical references (Drucker, Deming, Goldratt, etc.) and metrics (cycle time, lead time, work in progress, etc.) to share how Emergn focus on three themes of Value, Flow and Quality, with engagements they have.
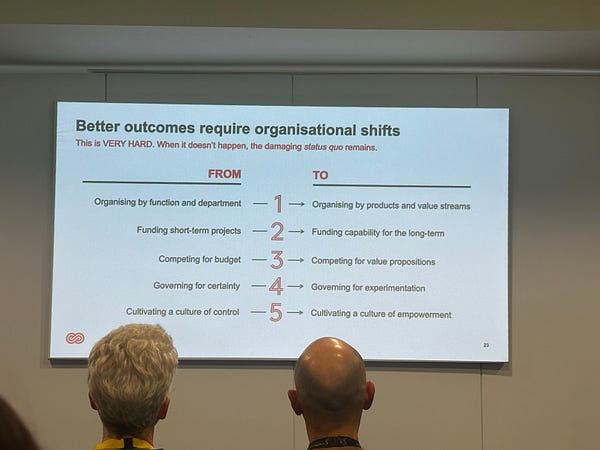
A key thing here being about measuring end to end flow (idea -> in the hands of users) rather than just the delivery cycle (code started -> deployed to production). Albeit, it may be that you have to start with the delivery cycle first, gathering the evidence/data on improving it, before going after the whole ‘system’.

We ended late morning/early lunch by going to Stephen Wilcock (Bloom & Wild) on Pivot to Profitability. Now, it wasn’t quite all relevant to us and where we work currently (not the fault of the speaker!) however there were still useful learnings like mapping business outcomes to teams (rather than Project or Feature teams) and the importance of feature prioritisation by CD3 (Cost of Delay Divided by Duration). Although there are sources that argue CD3 may not be the most effective way to prioritise.

We took a break after that, chatting to other attendees and digesting the morning, then before we knew it, it was time for lunch. Conference lunches can be really hit or miss and thankfully a great selection was available and, unlike other conferences, there were multiple stations to get your food from so “hangry-ness” was averted.

Afternoon

After lunch we were all really looking forward to the Leadership styles in the Royal Navy talk however, once we sat down for the session we actually realised we were in The Alignment Advantage session by Richard Nugent. That would be one small criticism of the conference in that it was really difficult to find a printed schedule (none were given out) and it seems schedule changes like this suffered as a result.

Thankfully, this talk was totally worth it. At the minute, we are reviewing and tweaking our Agile Leadership training and this gave us tonnes of new thinking/material we could be leveraging around strategy and the importance of alignment in achieving this. In the talk, Richard posed a series of questions for us all to note down our take on (either within our team or our organisation), such as:

  • What is strategy?

  • What is your key strategic objective?

  • What is your definition of culture?

  • On a scale of 1–6, to what degree does your current culture support the delivery of a strategic objective?

  • What is the distinction between service and experience?

  • What is your x?

What was great was, rather than leave this ambiguously for us to answer, Richard validated our understanding by giving his view on what the answer was to all the above. After the session, we were all very energised about how we could be using this approach for leaders we work with in ASOS and baking this into our leadership training.

After Richard it was time for Jon Smart and Thriving over surviving in a changing world. As big fans of his book Sooner, Safer, Happier, we were all particularly excited about this talk, and we were not disappointed. Jon highlighted that organisational culture is at the core of thriving, however, culture cannot be created, it has to be nurtured.

Leaders need to provide clear behavioural guardrails that are contextual and need to be repeatedly communicated to enable teams and leaders to hold each other to account.

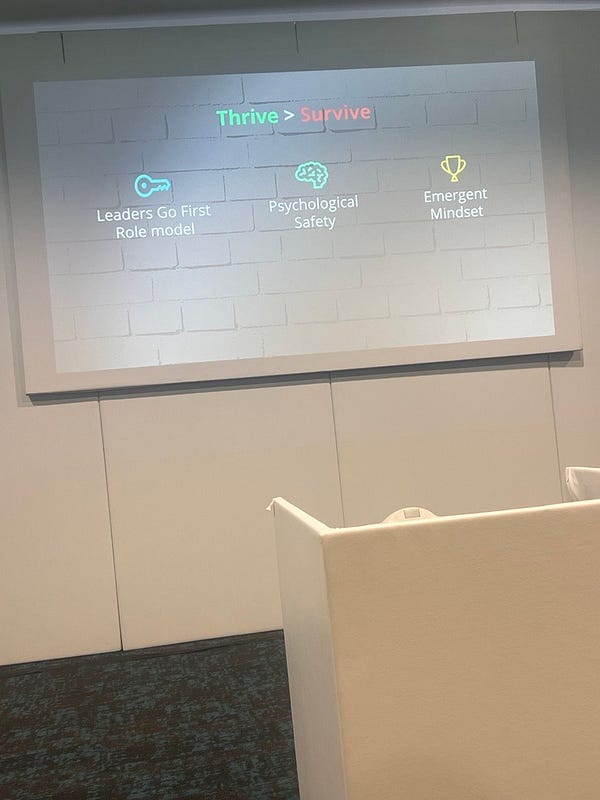
Jon went on to explain the three key factors for success:

  • Leaders go first, become a role model

  • Psychological safety

  • Emergent mindset; the future is unknown so experiment and optimise for that
At ASOS, one of our focuses is on flow, so when Jon spoke about intelligent flow by optimising for outcomes, we were all naturally intrigued. By having high alignment (through OKRs) with minimum viable guardrails, teams are empowered to experiment on how to best achieve their north star. However, something that is always forgotten about is limiting WIP at all levels to create a pull not push system, where organisations stop starting and start finishing.

As we all had to leave early, the last session for the day we went to was Ben Sawyers Leadership Lessons from bomb disposal operations in Iraq and Afghanistan. Sharing stories, pictures and diagrams from his several tours, Ben provided a detailed explanation of how the British Army use Mission Command to create a shared understanding of goals, while enabling teams to decide and own their tactics and approach.

This decentralised approach to leadership echoed many of the other talks throughout the day and reiterated the importance of trust to reach success. Ben also referred to Steve Williams’ approach of using a ‘hot wash up’ to reflect on recent activities and consider improvements for next time. To round off, it was interesting to hear that despite so many contextual differences, similarities in approaches have led to success in many different industries.

Key learnings

So what were our main takeaways?

One of the standouts has to be about the concepts around agility traversing multiple industries and domains, not limited to software development. It’s a great reminder as Coaches about the importance of language and how, when it comes to agility, people are likely already applying aspects of this in their day to day but calling it something else, and this is ok. Being able to have more anecdotes of what different industries use which are similar to what teams are using is great.

Secondly, the importance of focusing on outcomes and measuring impact when it comes to ways of working. As Coaches we’re talking more and more about moving teams away from measuring things like agile compliance (stand-up attendance, contribution to refinement) to the things that truly matter (speed, quality, value delivery).

Finally, the recurring theme of being outcome oriented and setting direction, allowing individuals and teams to choose their own path in how they get there being the most effective way to work. Rather than fixating on the how (e.g. methods/frameworks), it’s clear that whether you’re an agilist or not, alignment in strategy and direction is paramount for success.

For its price, SEAcon is probably the best value for money agile conference you’ll get the chance to attend. Good talks, networking and food make it one to watch out for when tickets go on sale — hopefully we’ll be back there in 2024!

Our survey says…uncovering the real numbers behind flow efficienc

Flow Efficiency is a metric that is lauded as being a true measure of agility yet it has never had any clear data supporting it, until now. This blog looks at over 60 teams here in ASOS and what numbers they see from a flow efficiency perspective…

A mockup of a family fortunes scoreboard for flow efficiency

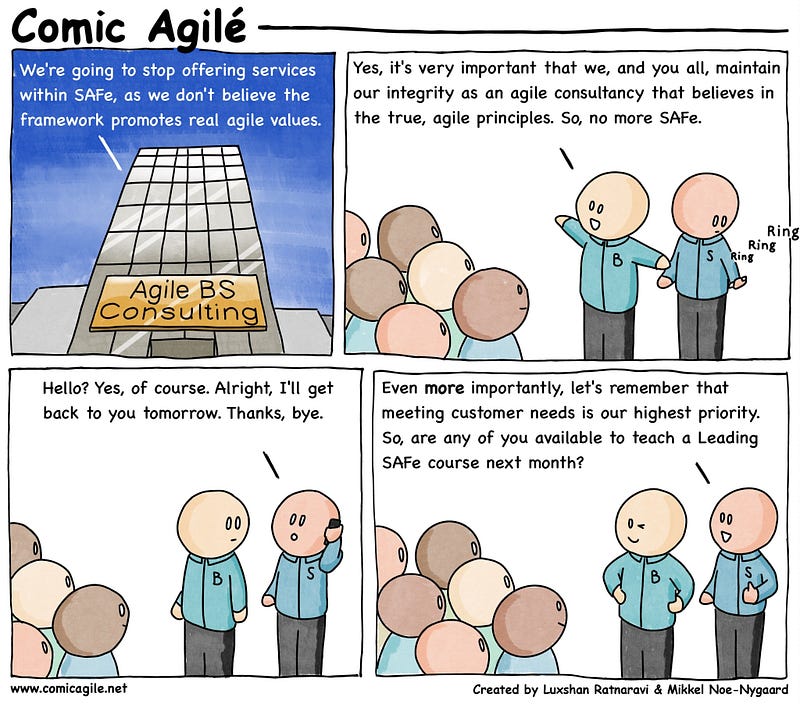
Not too long ago, I risked the wrath of the lean-agile world by documenting the many flaws of flow efficiency. It certainly got plenty of engagement — as it currently is my second most read article on Medium. On the whole it seemed to get mostly positive engagement (minus a few rude replies on LinkedIn!) which does make me question why it still gets traction through things like the flow framework and Scaled Agile Framework (SAFe). I put it down to something akin to this:

A comic of mocking a consutlancy changing their mind on selling SAFe

Source: No more SAFe

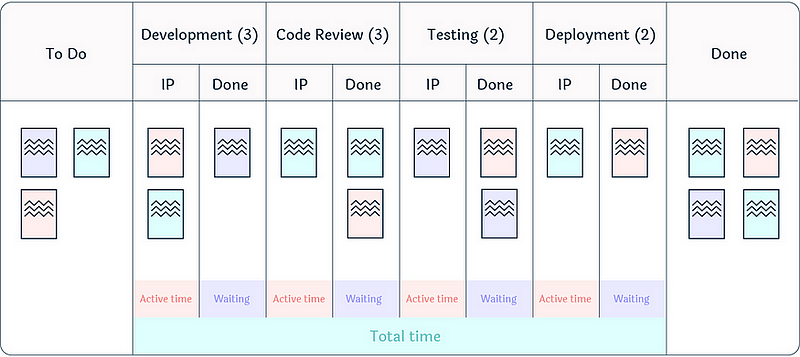
For those who missed the last post and are wondering what it is, flow efficiency is an adaptation of a metric from the lean world known as process efficiency. This is where, for a particular work item, we measure the percentage of active time — i.e., time spent actually working on the item against the total time (active time + waiting time) that it took to for the item to complete.

For example, if we were to take a team’s Kanban board, it may look something like this:

An example kanban board

Source: Flow Efficiency: Powering the Current of Your Work

Flow efficiency is therefore calculated like so:

An explanation of the flow efficiency calculation of active time divided by total time multiplied by 100

One of my main issues with Flow Efficiency is the way it is lauded as the ‘thing’ to measure. There are plenty of anecdotal references to it, yet zero evidence and/or data to back up the claims. Here’s some of the top results on Google:

None of these statements have any data to support the claims they make. Rather than bemoan this further, I thought, in line with the previous blog on Monte Carlo forecasting accuracy and with the abundance of teams we have in ASOS Tech, let’s actually look at what the data says…

Gathering data

At ASOS, I am very fortunate as a coach that those before me such as Helen Meek, Duncan Walker and Ian Davies, all invested time in educating teams about agility and flow. When randomly selecting teams for this blog, I found that none of the teams were missing “queues” in their workflow, which is often the initial stumbling block for measuring flow efficiency.

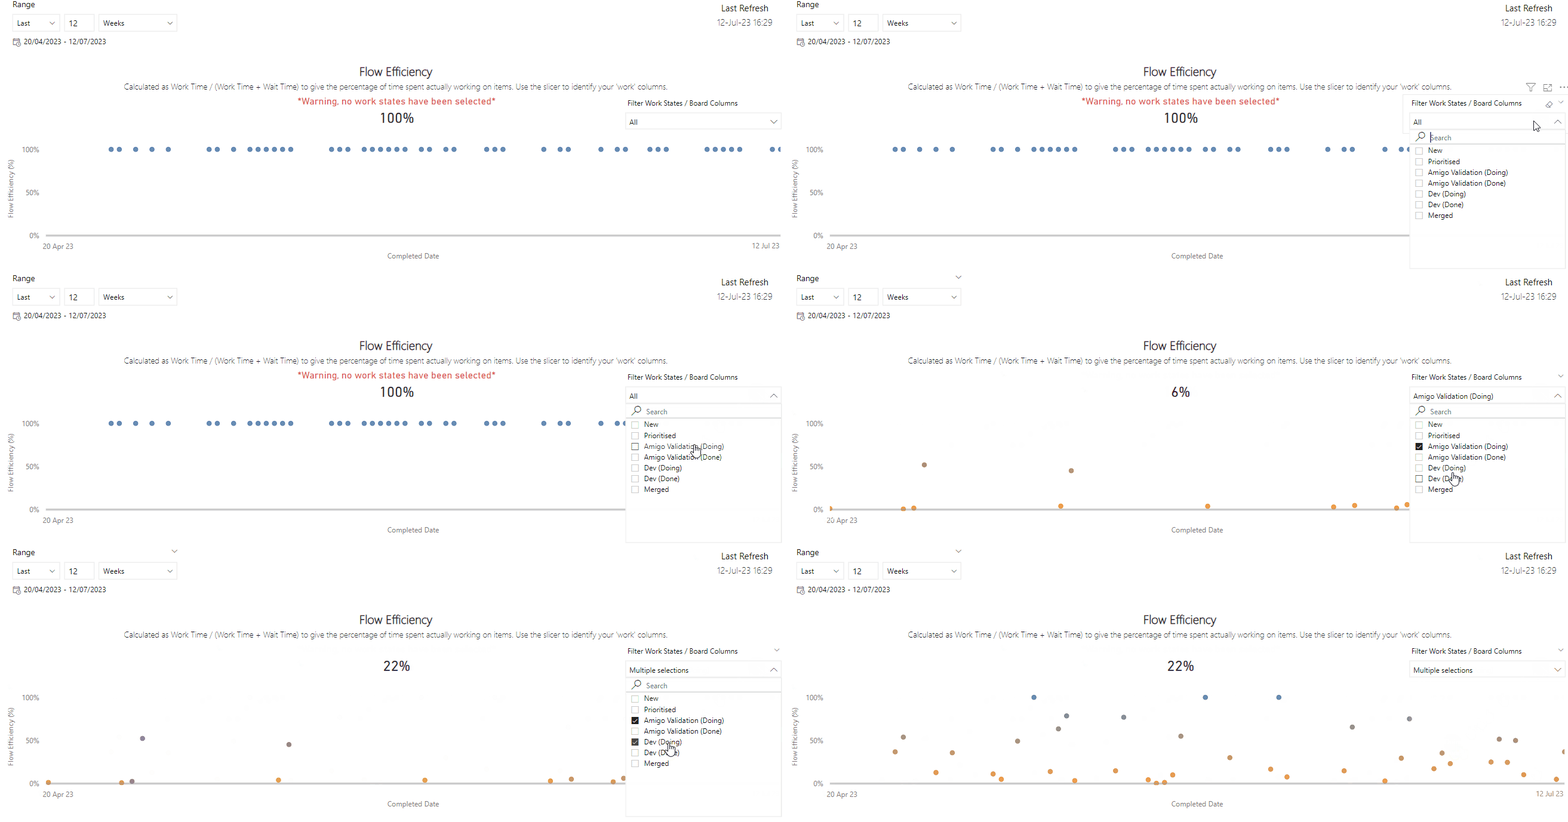
Flow Efficiency is one of the many metrics we have available to our ASOS Tech teams, to use when it comes to measuring their flow of work and as an objective lens in their efforts towards continuous improvement. Teams choose a given time period and select which steps in their workflow are their ‘work’ states (i.e. when work on an item is actually taking place):

An animation showing how teams configure their flow efficiency metric

Once they have done this, a chart will then plot the Flow Efficiency for each respective item against the completed date, as well as showing the average for all the completed items in that period. The chart uses a coloured scale to highlight those items with the lowest flow efficiency (in orange) through to those with the highest (in blue):

An example of a flow efficiency chart showing 29% for a completed item

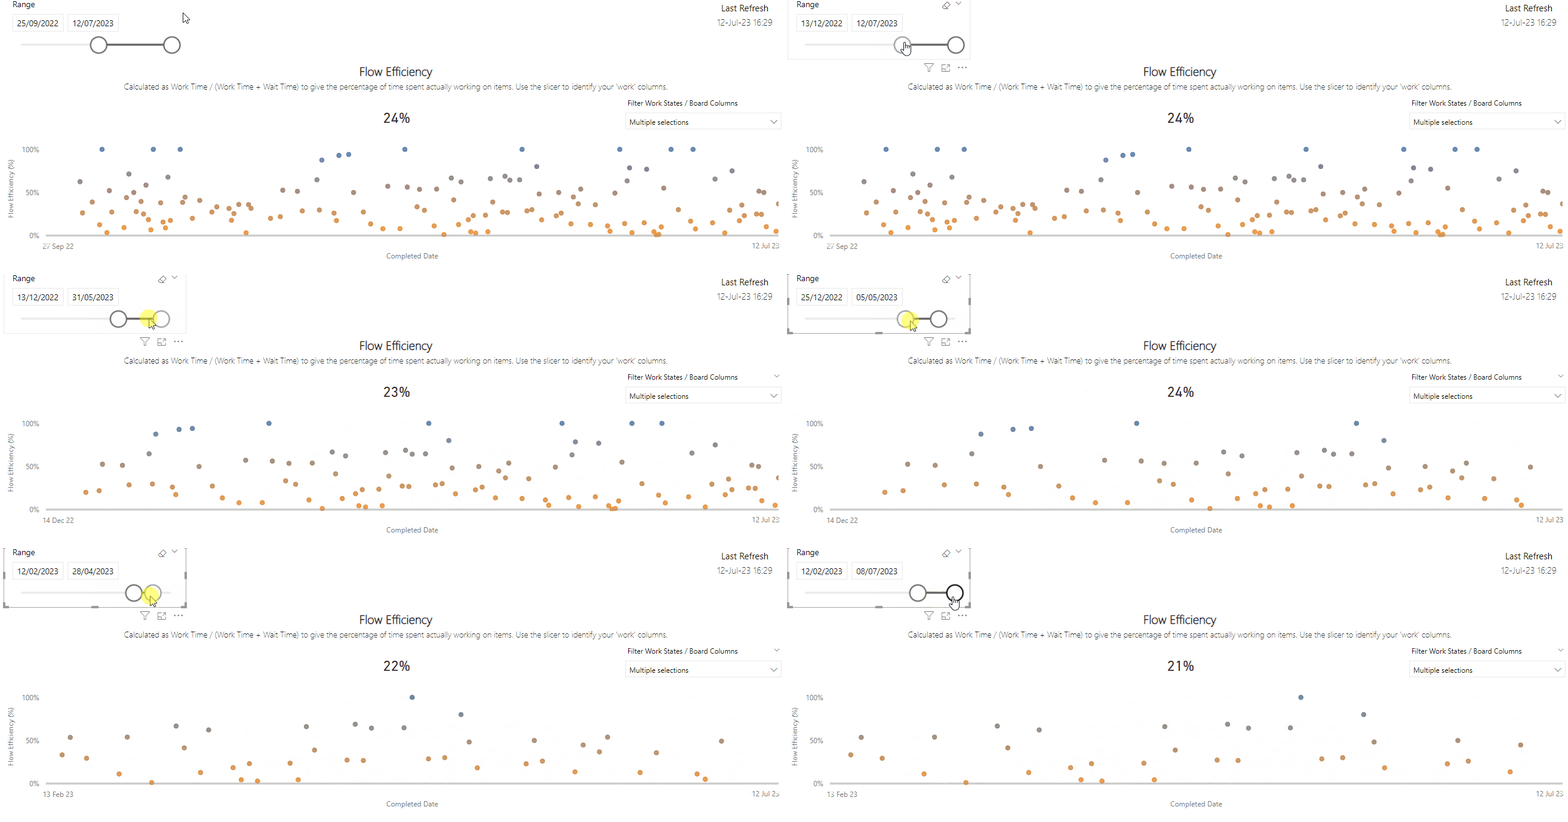
For this article, I did this process for 63 teams, playing around with the date slicer for periods over the last twelve months and finding the lowest and highest average flow efficiency values for a given period:

An animation showing the date range showing different flow efficiency calculations

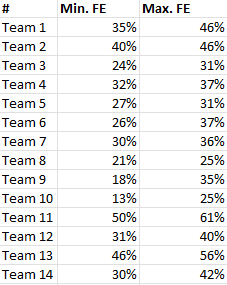
This was then recorded in my dataset like so:

A table showing the minimum and maximum flow efficiency measures for a team

All teams use a blend of different practices and frameworks — some use Scrum/ScrumBut, others use more Kanban/continuous flow or blend these with things like eXtreme Programming. Some teams are working on things you will see on the front-end/customer facing parts of the journey (e.g. Saved Items), others back-end system (e.g. tools we use for stock management and fulfilment).

Now that I’ve explained the data capture process — let’s look at the results!

Our survey says…

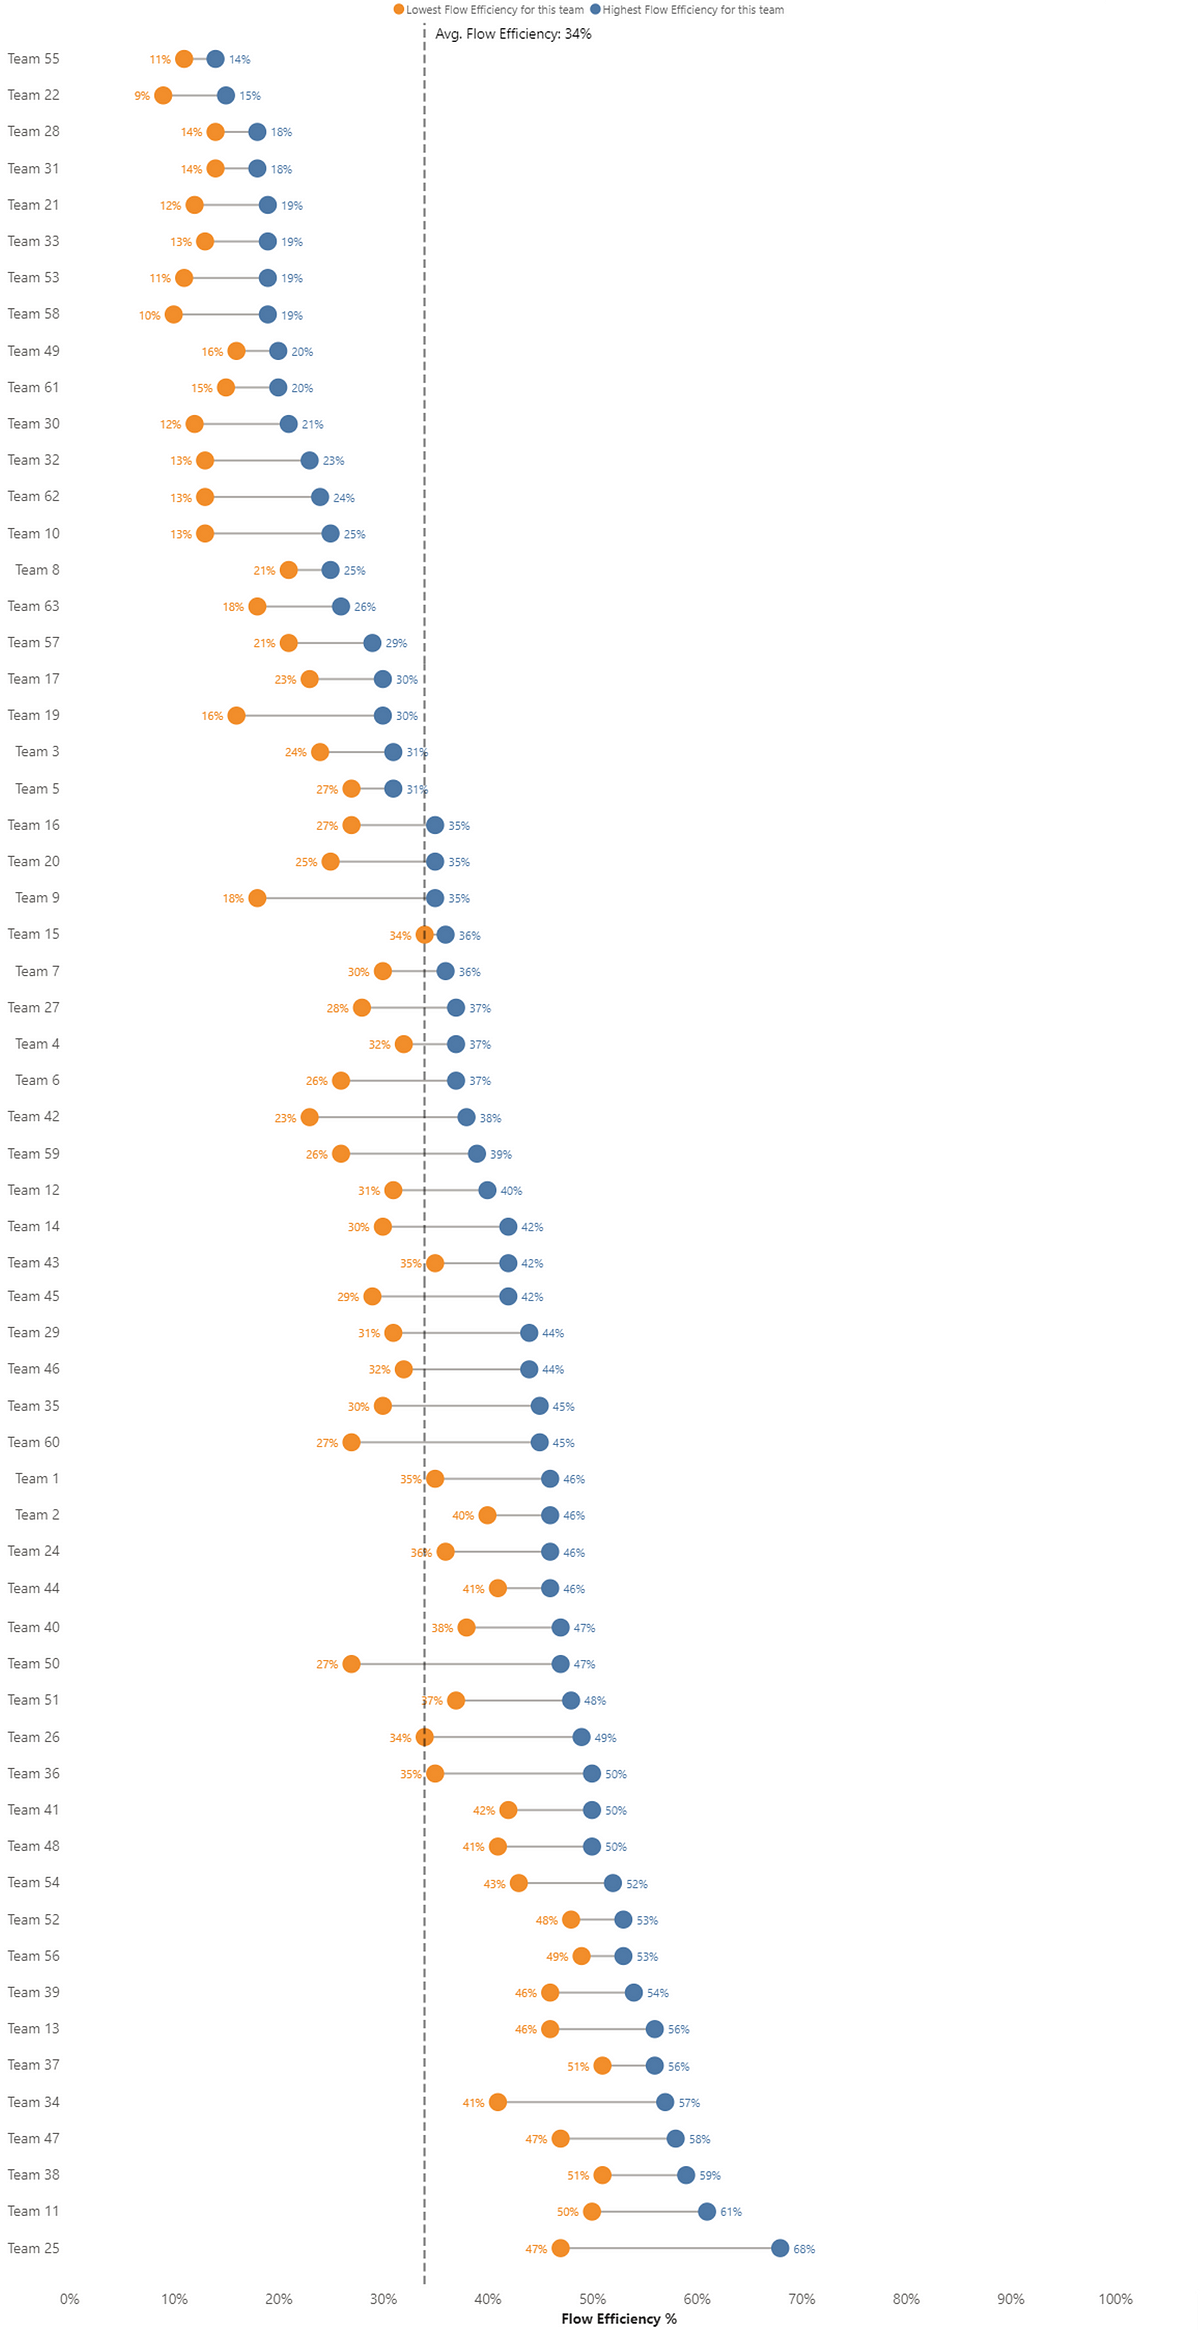
With so many teams to visualize, it’s difficult to find a way to show this that satisfies all. I went with a dumbbell chart as this allows us to show the variance in lowest-highest flow efficiency value per team and the average across all teams:

A summary dumbbell chart of the results showing a range of 9–68%

Some key findings being:

  • We actually now have concrete data around flow efficiency! We can see that with this study flow efficiency values from 9–68% have been recorded

  • The average flow efficiency is 35%

  • Flow efficiency has variability — any time you hear someone say they have seen flow efficiency values typically of n% (i.e. a single number), treat this with caution/scepticism as it should always be communicated as a range. We can see that all teams had variation in their values, with 38% of the teams in this data (25 of 63 teams) actually having a flow efficiency difference of >10%

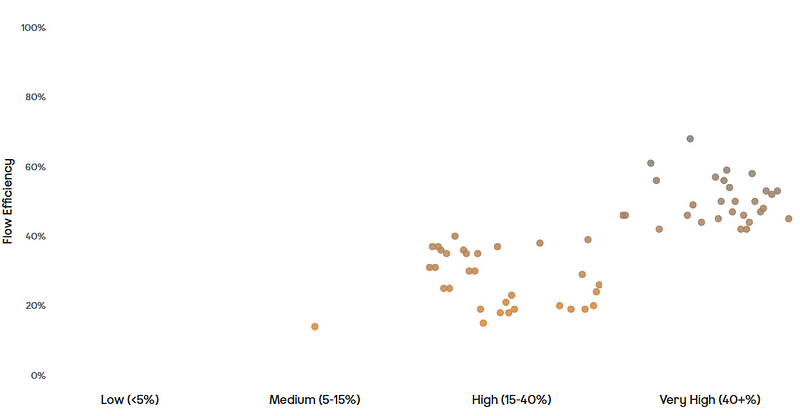
  • If we were to take some of those original quotes and categorised our flow efficiency based on what is ‘typically’ seen in to groups of Low (<5%), Medium (5–15%), High (15–40%) and Very High (>40%) then the teams would look something like this:

A chart showing the distribution of results

The problem with this is, whilst we do everything we can to reduce dependencies on teams and leverage microservices, there is no way nearly all teams have either high or very high flow efficiency.

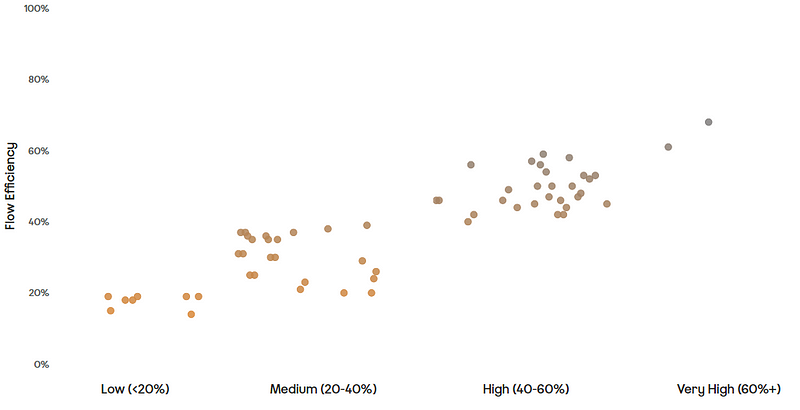
I believe a better categorisation that we should move to would be — Low (<20%), Medium (20–40%), High (40–60%) and Very High (>60%), as this would look like:

A chart showing an updated distribution of the results

But, but…these numbers are too high?!

Perhaps you might be reading this and have your own experiences and/or share the same views as those sources referenced at the beginning of the blog. There is no way I can disagree with your lived experience but I do think that when talking about numbers people need to be prepared to bring more to the conversation than anecdotal reference points. Are these numbers a reflection of the “true” flow efficiency of those items? Definitely not! There is all the nuances of work items not being updated in real time, work being in active states on evenings/weekends when it clearly isn’t being worked on (I hope!), work actually being blocked but not marked as blocked etc. — all of which I explained in the previous article.

Let’s take a second and look at what it would mean practically if you wanted to get a more ‘accurate’ flow efficiency number. Assume a team has a workflow like so:

An example kanban board

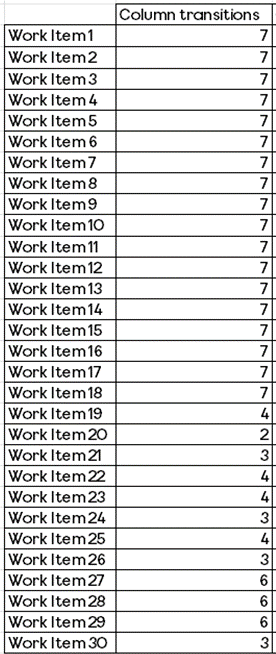
If we take for example, 30 work items that have been completed by this team in a one month period. We assume that 60% of those items went through all columns (7 transitions) and the remaining 40% skip some columns (2 to 6 transitions) — allowing for some variability in how items move through our workflow:

An example table of data showing column transitions

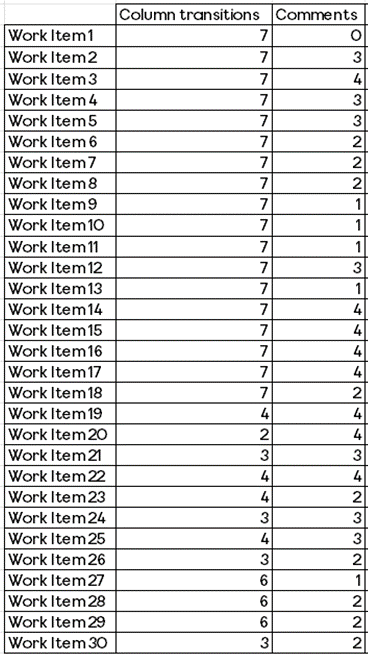
Then we assume that, like all teams at ASOS (or teams using tools like Azure DevOps or Jira), they comment on items. This could be to let people know something has progressed, clarify part of the acceptance criteria, ask a question, etc. Let’s say that this can happen anywhere from 0–4 times per item:

An example table of data showing column transitions and comment count

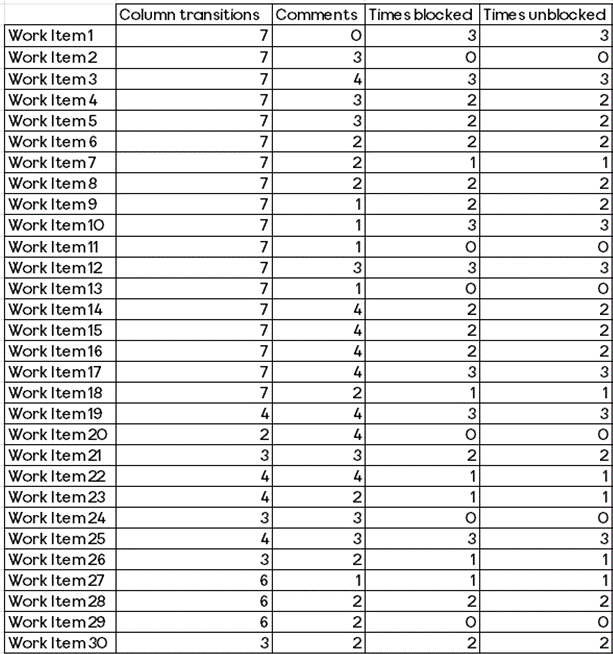
Not only that but we also mark an item when it is blocked and also then unblocked:

An example table of data showing column transitions, comment count, times blocked and unblocked

Note: randomised using Excel

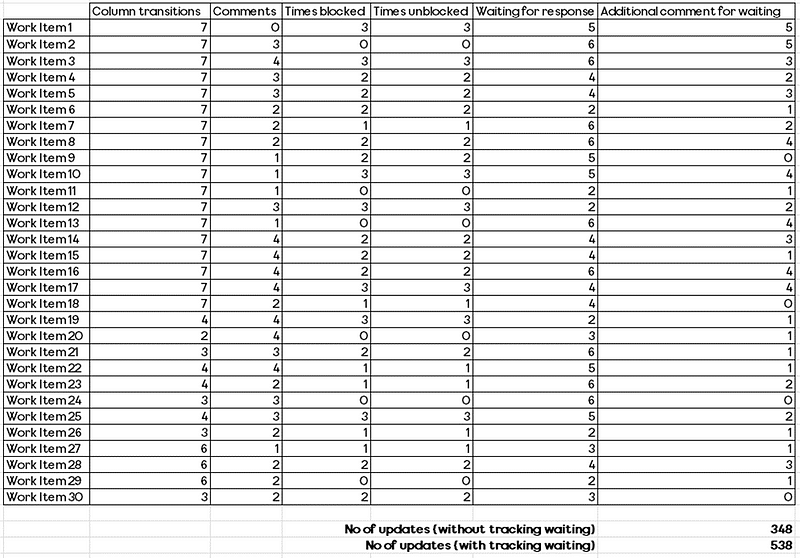
Now, if we just look at that alone, that means 348 updates to work items in a one month period. If we then wanted to add in when work is waiting, we would need to account for a few (2) or many (6 — conservatively!) times an item is waiting, as well as adding a comment sometimes (but not all the time) so that people know the reason why it is waiting:

An example table of data showing column transitions, comment count, times blocked and unblocked, wait time and waiting reason

Random values again calculated via Excel :)

We can already see that with these conservative guesses we’re adding nearly 200 more updates to just 30 work items. Once you start to do this at scale, whether that be for more items and/or more teams as well as over a longer period, you can see just how much additional work this means for teams in interacting with their tool of choice. Combine this with the costs of context switching (i.e. moving out of being ‘in the work’ to log into the tool that you are ‘waiting’) and you can see why tracking flow efficiency to more accuracy is a fools errand.

Summary

My hope is that we can now start to have a proper conversation around what ‘typical’ flow efficiency numbers we see. Whether it be what ‘typical’ values you see or what a ‘high’ flow efficiency looks like. To my knowledge this is the first attempt at something like this in our industry… and it should not be the last! In addition to this, I wanted to demonstrate what it would truly mean if you wanted a team to place more focus on getting an ‘accurate’ flow efficiency value.

For those wondering if it has changed my opinion on flow efficiency, as you can probably tell it has not. What I would say is that I have cooled a little on flaw #1 of teams not modelling queues in their workflow, given nearly all these teams had multiple queue states modelled (after good training/coaching). I still stand by the other flaws that come with it and now I hope folks who are familiarising themselves with it have this information as a common reference point when determining its appropriateness for them and their context.

What are the alternatives? Certainly Work Item Age would be a good starting point, as items aging at a rate greater than your historical cycle time might allude to an inefficient way of working. Another approach could also be looking at blocked work metrics and insights those bring.

What are your thoughts on the findings? Surprised? Sceptical? 

Let me know in the replies what you think…

Weeknotes #01

Why weeknotes?

Recently, I’ve been inspired a lot by reading the Weeknotes of both Sam Lewis and Rita Goodbody, who are doing some excellent work with Novastone Media. What’s great about their work is that each week they share their learnings (please give them both a follow!), both being very open around challenges they’re facing, accomplishments they’ve made each week and share their stories. After getting into the habit of checking Twitter on a Friday afternoon for their latest posts, I figured why not give it a try myself. 

Special mention to Sam who I have known for a while now through the Kanban world, who first introduced me to the concept. 

Like him I really like this point:

Writing creates a basic feedback loop. Before getting feedback from other people, you can literally get feedback from yourself.

So yes, this will be something I’ll be trialling for a bit…

Helping others learn, whilst learning myself

This week I ran a ‘Hands on with Azure DevOps’ session for our Project Management group. Having been asked by another area of PwC to run a similar session in March, I offered out the opportunity for the PM’s to be the first to experience it…with the proviso that it was the first iteration so not everything would work smoothly! 

One thing I have learned in adoption of new tools is just showing how to use it isn’t enough, so I created a sandbox Azure DevOps collection/organisation setup each attendee with their own project, then showing them how to do something, then they get to create their own variation within their environment. I had printed workbooks as a supporting tool (in case they got stuck), but deliberately only had enough for one per pair, forcing a bit of collaboration. A few things went wrong, mainly in how I structured the first bit of the course by having them create multiple teams, on reflection I realised that keeping it simple and using the default team would have been better. Generally, people said they really enjoyed it and that it has helped them learn a lot more, with also some feedback that the pace was maybe a little too quick, so there’s a bit of learning for me as well around my delivery.

Training, training and more training

The rest of the week has been mainly filled with continuing internal enablement through our team running 1-day Agile Foundations courses. 

On Tuesday I paired up with Marie to run a session, and yesterday myself and Dan delivered another. I’m shocked that so many people have signed up (out of a function of 220 people, 180 people will have attended by the end of March), as we were very clear in wanting people to “pull” the training, rather than be forced to attend. One person who attended yesterday said in the intro that they had ‘high expectations’ because they had heard so many good things, which was nice to hear and set the tone for a good day. Based on the feedback we received it seems all attendees really enjoyed it. One individual let us know that it was “probably the best training they have been to in years” which, whilst very flattering, does make me wonder what other training they have attended!

Mid-flow on my favourite topic (metrics)

The course itself is very hands on, we’re keen to give people the principles and also dispel some myths that Agile = Fast and/or Agile = Scrum, something which is a bit of a personal bugbear of mine. We introduce the manifesto and the principles then support that with a game of Agile Eggcellence, then cover Scrum before lunch (using the Scrum guide — not some internally warped version of Scrum) as well as the often overlooked technical excellence aspects such as CI/CD. After lunch we introduce the Kanban method using Featureban, then go into User Stories, Minimum Viable Product, again supporting that with some examples and the Bad Breathe MVP game.

Final section of the day is centered on business agility — here we look at INGs Agile Ways of Working journey (to inspire — not to copy/paste!), the outputs from the State of DevOps report, as well as internal/client case studies. 

The main thing here is in an IT context to open up the discussion around what our impediments are and, more importantly, how can we collectively overcome them. Once that’s done we finish with a game of “40 seconds of Agile” — a variation on 30 seconds of Scrum with some Pocket Scrum Guides for the winning team.

Marie and Dan have both grown into the delivery of the training incredibly well. When we first started these sessions it was myself doing the majority with themselves supporting, whereas now most sessions are split 50/50. 

They are both also great at weaving in their own experience/stories into their delivery which for me, adds a further element of ‘realism’ for attendees. I’m very fortunate to work with them (as well as James and Jon in our team) as part of our Agile Collaboratory team, in particular due to their enthusiastic yet pragmatic approach.

Going for (Agile) Gold

Eyes closed — no gold medal for being photogenic

Wednesday night we held our first Agile Olympics event within one of our London offices. The event was in two parts, for the first half teams were given a case study around product decomposition and had a roughly an hour to analyse a case study and do some initial visioning around the product and producing a vision with various increments as part of it. The second half was a quiz using the Kahoot app, with prizes for the top three teams for both rounds. I was heavily involved in helping formulate the case study and write the quiz, as well as being one of the main judges for the case study outputs from the teams. It was a really fun event, with nine teams across different business lines entering. All of them did a great job in focusing on user needs and business outcomes for their product, rather than outputs and making a list of features. Some Partners appeared to be a bit upset at their quiz performance and demanded copies of the answers which, given the quiz contained a number of anti-pattern questions (what is Sprint Zero, etc.) shows to me we still have work to do internally. We’re hoping this is the start of many events where we can grow the Agile & DevOps coaching network across the UK.

Project to Product

Over the Christmas period, I found myself immersed in Mik Kersten’s Project to Product book. For me, the book is brilliant and very much represents the future of work for large organisations that they need to adopt in order to remain relevant/successful. Product thinking and the whole #NoProjects movement has been a keen interest of mine in the past two years, with us slowly starting to introduce some of that thinking internally. The past few weeks we’ve been formulating our first Value Stream which, for our context will be a service (with a set of long-lived products) or a major product, with multiple teams within the value stream supporting that delivery.

One of the things we’ve been looking at is the roles within a value stream, whilst teams will self-organise to choose their own framework/ways of working, what should be the role of the person ‘owning’ that value stream?

The working title we have gone with is a Value Stream Owner (VSO), with the following high-level responsibilities:

The owner for the Value Stream must be able to manage, prioritise and be responsible for maximising the delivery of value for PwC, whilst staying true to Lean-Agile principles. 

Specifically, there is an expectation for this individual to be comfortable with:

  • Small batch sizing (MVPs/MMFs), prioritisation and limiting work in progress (WIP)

  • Stakeholder management and potentially saying ‘not yet’ to starting new work

  • Learning and understanding flow metrics, using these to gain better insight and improve the flow of value

  • Inspect and adapt — You will be familiar with the concept of ‘inspect and adapt’ and showcase that in your work

  • Focusing on business outcomes over outputs

  • Ensure that continuous improvement is at the core of everything you do and that you encourage all members of the value stream to be on the lookout for new and better ways of creating value

It’s proving to be challenging, mainly due to finding suitable groupings for such a large IT estate, but we’re getting there…hoping to formulate the team(s) in the next 2 weeks and start working through the Value Stream backlog.

Next week

Next week I’m heading out to Wroclaw, visiting one of our suppliers which should be interesting (I get to meet their Tribes — and no they are not a music streaming company!). Travelling abroad always presents a challenge for me, I don’t like compromising on not attending key meetings in the UK just because I’m out of the country, so will be a delicate balancing act of getting value from the trip vs not getting behind on other work. I’ll be sure to share next week how that goes.