Scrum

Cycle Time Correlations

Improving flow is a key goal for nearly all organisations. More often than not, the primary driver for this is speed, commonly referred to as Cycle Time. As organisations try to reduce this and improve their time to (potential) value, what factors correlate with speed? This blog, inspired by the tool DoubleLoop, looks at the correlations Cycle Time has with other flow-based data…

The correlation of metrics

A few months ago I came across a tool called DoubleLoop. It is unique in that it allows you to plot your strategy in terms of your bets, the work breakdown and key metrics, all onto one page. The beauty of it is that you can see the linkage to the work you do with the metrics that matter, as well as how well (or not so well) different measures correlate with each other.

For product-led organisations, this opens up a whole heap of different options around visualising bets and their impact. The ability to see causal relationships between measures is a fantastic invitation to a conversation around measuring outcomes.

Looking at the tool with a flow lens, it also got me curious, what might these correlations look like from a flow perspective? We’re all familiar with things such as Little’s Law but what about the other practices we can adopt or the experiences we have as work flows through our system?

As speed (cycle time) is so often what people care about, what if we could see which measures/practices have the strongest relationship with this? If we want to improve our time to (potential) value, what should we be focusing on?

Speed ≠ value and correlation ≠ causation

Before looking at the data, an acknowledgement about what some of you reading may well be pointing out.

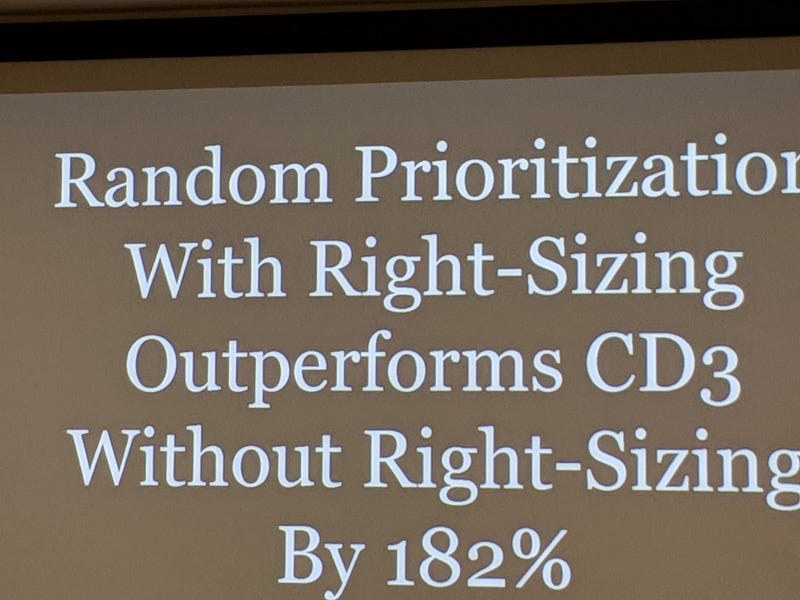
The first is that speed does not equate to value, which is a fair point, albeit one I don’t believe to be completely true. We know from the work of others that right-sizing trumps prioritisation frameworks (specifically Cost of Delay Divided by Duration — CD3) when it comes to value delivery.

Given right-sizing is part influenced by duration (in terms of calendar days), and the research above, you could easily argue that speed does impact value. That being said, the data analysed in this blog looked at work items at User Story/Product Backlog Item level, which is difficult to quantify the ‘value’ that brings.

A harder to disagree with point is the notion that correlation does not equal causation. Just like the biomass power generated in the Philippines correlates with Google searches for ‘avocado toast’, there probably isn’t a link between the two.

However, we often infer in working with our teams about things they should be doing when using visual management of work. For some, these are undoubtedly linked, for example how long an item has been in-progress is obviously going to have a strong relationship with how long it took to complete. Others are more for up for debate such as, do we need to regularly be updating work items? Or should we be going granular with our board design/workflows? The aim of this blog is to try challenge some of that thinking, backed by data.

For those curious, a total of 15,421 work items completed by 70 teams over the since June 1st 2024 were used as input to this research. Given this size, there may be other causal relationships at play (team size, length of time together, etc.) that are not included in this analysis.

Without further delay, let’s start looking at the different factors that may influence Cycle Time…

Days since an item was started (Work Item Age)

One of the most obvious factors that plays into Cycle Time is how long an item has been in-progress, otherwise known as Work Item Age.

Clearly this has the strongest correlation with Cycle Time as, when your item is in-progress, it will have been in that state for a number of days and then once it moves to ‘done’ there should never be a difference in those two values.

The results reflect that with a correlation coefficient of 1.000, and about as strong a positive correlation as you will ever see. This means that above everything else, we should always be focusing on Work Item Age if we’re trying to improve speed.

Elapsed time since a work item was created (Lead Time)

The next thing to consider is how long it’s been since an item was created. Often referred to as ‘Lead Time’, this will often be different to Cycle Time as there may be queues before work actually starts on an item.

This is useful to validate our own biases. For example, I have often made the case to teams that anything older than three months on the backlog probably should just be deleted, as YAGNI.

This had a correlation coefficient with of 0.713, which is a very strong correlation. This is to be largely expected, as longer cycle times invariably will mean longer lead times, given it (more often than not) makes up a large proportion of that metric.

Time taken to start an item

A closely related metric to this is the time (in days) it took us to start work on an item. There are two schools of thought to challenge here. One is the view of “we just need to get started” and the other being that potentially the longer you leave it, the less likely you’re going to have that item complete quickly (as you may have forgotten what it is about).

This one surprised me. I expected somewhat a stronger relationship than the 0.166 correlation. This shows there is some relationship but it is weak and therefore not going to impact your cycle time how quickly you do (or don’t!) start work on an item.

The number of comments on a work item

The number of comments made on a work item is the next measure to look at. The idea with this measure would be that more comments likely mean items take longer, due to their being ambiguity around the work item, blockers/delays, feedback etc.

Interestingly in this dataset there was minimal correlation, with a correlation coefficient of 0.147. This suggests there is a slight tendency for work items with more comments to have a longer cycle time, but we can see that after 12 or so comments this doesn’t seem to be true. This could be that by this point, clarification is reached/issues are resolved. Of course, once we go past this value there are far less items that have that amount of comments.

The number of updates made to a work item

How often a work item is updated is the next measure to consider. The rationale for this being teams are often focused on ensuring work items are ‘up to date’ and trying to avoid them going stale on the board:

An update is any change made to an item which, of course means that automations could be in place to skew the results. With the data used, it was very hard to determine those which were automated updates vs. genuine ones, which means there is a shortcoming in using this. There were some extreme outliers with more than 120 updates, which were easy to filter out. However once I started going past this point there was no way to easily determine which were automated vs. genuine (and I was not going to do this for all 15,421 work items!).

Interestingly here we see a somewhat stronger correlation than before, of 0.261. This is on the weak to moderate scale correlation wise. Of course this does not mean just automating updates to work items will improve flow!

The number of board columns a team has

The next measure to consider is the number of board columns a team has. The reason for looking at this is that there are different schools of thought around how ‘granular’ you should go with your board design. Some argue that To Do | Doing | Done is all that is needed. Others would say viewing by specialism helps see bottlenecks and some would even say more high-level views (e.g. Options | Identifying the problem | Solving the problem | Learning) encourages greater collaboration.

The results show that really, it doesn’t matter what you do. The weak correlation of 0.046 shows that really, board columns don’t have any part to play in relation to speed.

Flow Efficiency

Flow efficiency is an adaptation from the lean world metric of process efficiency. This is where for a particular work item we measure the percentage of active time — i.e., time spent actually working on the item against the total time (active time + waiting time) that it took to for the item to complete.

This one was probably the most surprising. A correlation coefficient of -0.343 suggests a moderate negative correlation. What this means is that as Flow Efficiency increases, Cycle Time tends to decrease. The correlation of -0.343 shows this the relationship between the two whilst not very strong is certainly meaningful.

The number of times a work item was blocked

The final measure was looking at how often a work item was blocked. The thinking with this one would be if work is frequently getting blocked then surely this will increase the cycle time.

It’s worth noting a shortcoming here is not how long it was blocked for, just how often blocked. So, for example, if an item was blocked once but it was blocked for nearly all the cycle time, it would still only register as being blocked once. Similarly, this is obviously dependant on teams blocking work when it is actually blocked (and/or having a clear definition of blocked).

Here we have the weakest of all correlations, 0.021. This really surprised me as I would have thought the blocker frequency would impact cycle time, but the results of this suggest otherwise.

Summary

So what does this look like when we bring it all together? Copying the same style of DoubleLoop, we can start to see which of our measures have the strongest and weakest relationship with Cycle Time:

What does this mean for you and your teams?

Well, it’s clear that Work Item Age is the key metric to focus on, given just how closely it correlates with Cycle Time. If you’re trying to improve (reduce) Cycle Time without looking at Work Item Age, you really are wasting your efforts.

After that, you want to consider how long something has been on the backlog for (i.e. how long it was since it was created). Keeping work items regularly updated is the next thing you can be doing to reduce cycle time. Following this, retaining a balance of the time taken to start a work item and keeping an eye on the comment count would be something to consider.

The number of board columns a team has and how often work is marked as blocked seem to have no bearing on cycle time. So don’t worry too much about how simplified or complex your kanban board is, or focusing retros on those items blocked the most. That being said, a shortcoming of this data is that it is missing the impact of blockers.

Finally, stop caring so much about flow efficiency! Optimising flow efficiency is more than likely not going to make work flow faster, no matter what your favourite thought leader might say.

Adding Work Item Age to your Jira issues using Power Automate

A guide on how you can automate adding the flow metric of Work Item Age directly into your issues in Jira using Power Automate…

Context

As teams increase their curiosity around their flow of work, making this information as readily available to them is paramount. Flow metrics are the clear go-to as they provide great insights around predictability, responsiveness and just how sustainable a pace a team is working at. There is however, a challenge with getting teams to frequently use them. Whilst using them in a retrospective (say looking at outliers on a cycle time scatter plot) is a common practice, it is a lot harder trying to embed this into their every day conversations. There is no doubt these charts add great value but, plenty of teams forget about them in their daily sync/scrums as they will (more often than not) be focused on sharing their Kanban board. They will focus on discussing the items on the board, rather than using a flow metrics chart or dashboard, when it comes to planning for their day. As an Agile Coach, no matter how often I show it and stress the importance of it, plenty of teams that I work with still forget about the “secret sauce” of Work Item Age in their daily sync/scrum as it sits on a different URL/tool.

Example Work Item Age chart

This got me thinking about how to might overcome this and remove a ‘barrier to entry’ around flow. Thankfully, automation tools can help. We can use tools like Power Automate, combined with Jira’s REST API, to help improve the way teams work through making flow data visible…

Prerequisites

There are a few assumptions made in this series of posts:

With all those in place — let’s get started!

Adding a Work Item Age field in Jira

The first thing we need to do is add a custom field for Work Item Age. To do this, navigate to your Jira project you want to add this in. Click on ‘Project settings’ then choose a respective issue type (in this case we’re just choosing Story to keep it simple). Choose ‘Number’ and give the field the name of Work Item Age (Days) and add the description of what this is:

Once done, click ‘Save Changes’. If you want to add it for any other issue types, be sure to do so.

Finding out the name of this field

This is one of the trickier parts of this setup. When using the Jira REST API, custom fields do not give any indication as to what they refer to in their naming, simply going by ‘CustomField_12345’. So we have to figure out what our custom field for work item age is.

To do so, (edit: after posting, Caidyrn Roder pointed me to this article) populate a dummy item with a unique work item age, like I have done here with the value 1111:

Next, use the API to query that specific item and do a CTRL + F till you find that value, it will look similar to the below, just change the parts I’ve indicated you need to replace:

https://[ReplaceWithYourJiraInstanceName].atlassian.net/rest/api/2/search?jql=key%20%3D%20[ReplaceWithTheKeyOfTheItem]

My example is:
https://nickbtest.atlassian.net/rest/api/2/search?jql=key%20%3D%20ZZZSYN-38

Which we can do a quick CTRL + F for this value:

We can see that our Work Item Age field is called — customfield_12259. This will be different for you in your Jira instance! Once you have it, note it down as we’re going to need it later…

Understanding how Work Item Age is to be calculated

When it comes to Jira, you have statuses that are respective to a particular workflow. These will be statuses items move through and also map to columns on your board. Status categories are something not many folks are aware of. These are essentially ‘containers’ for where statuses sit. Thankfully, there are only three — To do, In Progress and Done. These are visible when adding statuses in your workflow:

An easier to understand visual representation of it on a kanban board would be:

What’s also helpful is that Jira doesn’t just create a timestamp when an item changes Status, it also does it when it changes Status Category. Therefore we can use this to relatively easily figure out our Work Item Age. Work Item Age is ‘the amount of elapsed time between when a work item started and the current time’. We can think of ‘started’ as being the equivalent to when an item moved ‘In Progress’ — we can thus use our StatusCategoryChangedDate as our start time, the key thing that we need to calculate Work Item Age:

Automating Work Item Age

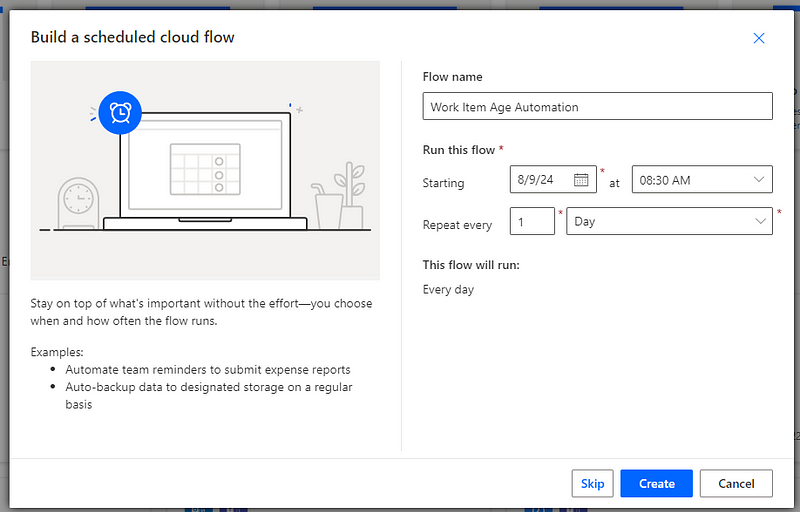
First we need to setup the schedule for our flow to run. To do this you would navigate to Power Automate and create a ‘Scheduled cloud flow’:

The timing of this is entirely up to you but my tip would be to do be before the daily stand-up/sync. Once you’re happy with it give it a name and click ‘Create’:

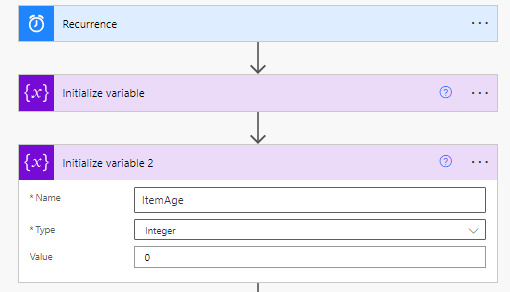
Following this we are going to add a step to Initialize variable — this is essentially where we will ‘store’ what our Issue Key is in a format that Power Automate needs it to be in (an array) with a value of ‘[]’:

We are then going to add the Initialize variable step again— this time so we ‘store’ what our Work Item Age is which, to start with, will be an integer with a value of 0:

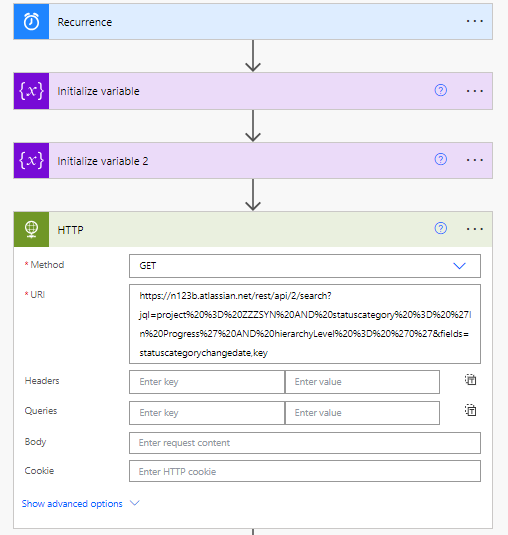
After this, we’re going to add a HTTP step. This is where we are going to GET all our ‘In Progress’ issues and the date they first went ‘In Progress’, referred to in the API as the StatusCategoryChangedDate. You’ll also notice here I am filtering on the hierarchy level of story (hierarchy level = 0 in JQL world) — this is just for simplicity reasons and can be removed if you want to do this at multiple backlog hierarchy levels:

https://[ReplaceWithYourJiraInstanceName].atlassian.net/rest/api/2/search?jql=project%20%3D%20[ReplaceWithYourJiraProjectName]%20AND%20statuscategory%20%3D%20%27In%20Progress%27%20AND%20hierarchyLevel%20%3D%20%270%27&fields=statuscategorychangedate,key My example: https://n123b.atlassian.net/rest/api/2/search?jql=project%20%3D%20ZZZSYN%20AND%20statuscategory%20%3D%20%27In%20Progress%27%20AND%20hierarchyLevel%20%3D%20%270%27&fields=statuscategorychangedate,key

You will then need to click ‘Show advanced options’ to add in your API token details. Set the authentication to ‘Basic’, add in the username of the email address associated with your Jira instance and paste your API token into the password field:

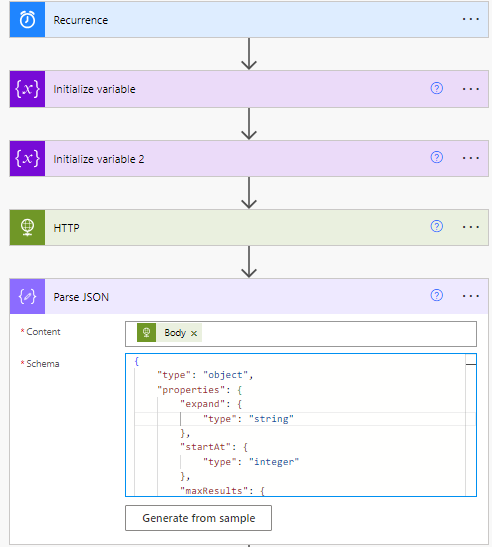
Then we will add a PARSE JSON step to format the response. Choose ‘body’ as the content and add a schema like so:

{
    "type": "object",
    "properties": {
        "expand": {
            "type": "string"
        },
        "startAt": {
            "type": "integer"
        },
        "maxResults": {
            "type": "integer"
        },
        "total": {
            "type": "integer"
        },
        "issues": {
            "type": "array",
            "items": {
                "type": "object",
                "properties": {
                    "expand": {
                        "type": "string"
                    },
                    "id": {
                        "type": "string"
                    },
                    "self": {
                        "type": "string"
                    },
                    "key": {
                        "type": "string"
                    },
                    "fields": {
                        "type": "object",
                        "properties": {
                            "statuscategorychangedate": {
                                "type": "string"
                            }
                        }
                    }
                },
                "required": [
                    "expand",
                    "id",
                    "self",
                    "key",
                    "fields"
                ]
            }
        }
    }
}

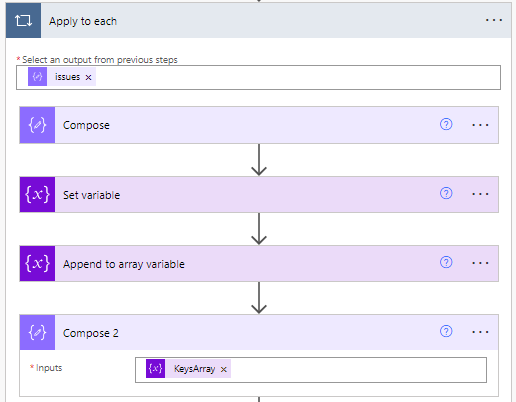
Then we need to add an Apply to each step and select the ‘issues’ value from our previous PARSE JSON step:

Then we’re going to add a Compose action — this is where we’ll calculate the Work Item Age based on todays date and the StatusCategoryChangedDate, which is done as an expression:

div(sub(ticks(utcNow()), ticks(items('Apply_to_each')?['fields']?['statuscategorychangedate'])), 864000000000)

Next we’ll add a Set Variable action to use the dynamic content outputs from the previous step for our ItemAge variable:

Then add an Append to array variable action where we’re going to append ‘key’ to our ‘KeysArray’:

Then we’ll add another Compose action where we’ll include our new KeysArray:

Then we’re going to add another Apply to each step with the outputs of our second compose as the starting point:

Then we’re going to choose the Jira Edit Issue (V2) action which we will populate with our Jira Instance (choose ‘Custom’ then just copy/paste it in), ‘key’ from our apply to each step in the Issue ID or Key field and then finally in our ‘fields’ we will add the following:

Where ItemAge is your variable from the previous steps.

Once that is done, your flow is ready — click ‘Save’ and give it a test. You will be able to see in the flow run history if it has successfully completed.

Then you should have the Work Item Age visible on the issue page:

Depending on your Jira setup, you could then configure the kanban board to also display this:

Finally, we want to make sure that the work item age field is cleared any time an item moves to ‘Done’ (or whatever your done statuses are). To do this go to the Project Settings > Automation then setup a rule like so:

That way Work Item Age will no longer be populated for completed items, as they are no longer ‘in progress’.

Hopefully this is a useful starting point for increasing awareness of Work Item Age on issues/the Jira board for your team :)

Framework agnostic capacity planning at scale

How can you consistently plan for capacity across teams without mandating a single way of working? In this blog I’ll share how we are tackling this in ASOS Tech…

What do we mean by capacity planning?

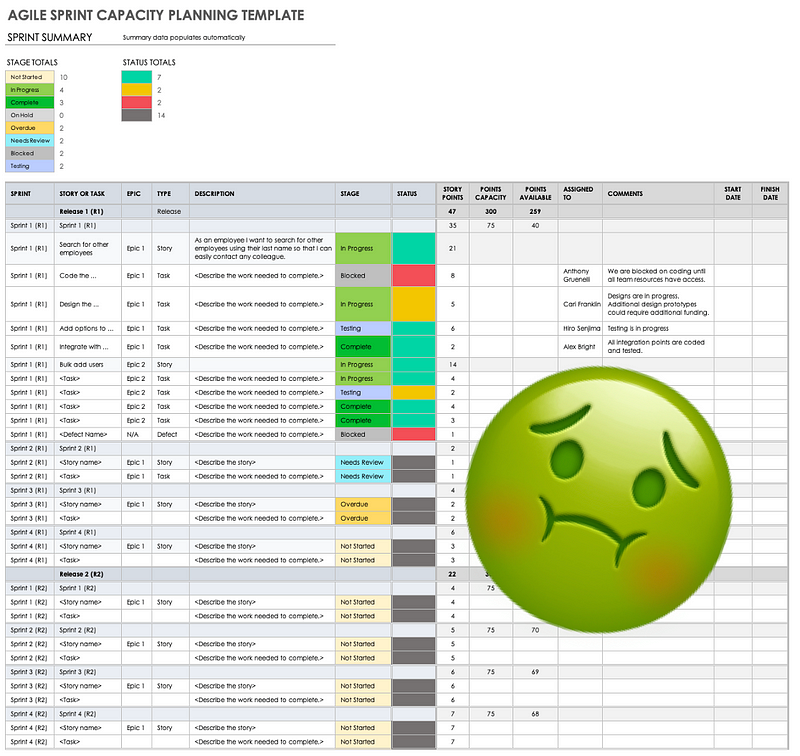
Capacity planning is an exercise undertaken by teams for planning how much work they can complete (in terms of a number of items) for a given sprint/iteration/time duration. Sadly, many teams go incredibly detailed with this, getting into specifics of the number of hours available per individual per day, number of days holiday and, even worse, using story points:

When planning on a broader scale and at longer term horizons, say for a quarter and looking across teams, the Scaled Agile Framework (SAFe) and its Program Increment (PI) planning appears to be the most popular approach. However, with its use of normalised story points, it is quite rightly criticised due to it (whatever your views on them may be) abusing the intent of story points and, crucially, offering teams zero flexibility in choosing how they work.

At ASOS, we pride ourselves as being a technology organisation that allows teams autonomy in how they work. As Coaches, we do not mandate a single framework/way of working as we know that enforcing standardisation upon teams reduces learning and experimentation.

The problem that we as Coaches are trying to solve is aligning on a consistent understanding and way to calculate capacity across teams all whilst avoiding the mandating of a single way of working and aligning with agile principles. Our current work on this has led us down the path of taking inspiration from the work of folks like Prateek Singh in scaling flow through right-sizing and probabilistic forecasting.

Scaling Simplified: A Practitioner’s Guide to Scaling Flow eBook : Singh, Prateek: Amazon.co.uk: Books

How we are doing it

Right-sizing

Right-sizing is a practice where we acknowledge and accept that there will be variability in sizes of work items at all levels. What we focus on is, depending on backlog level, understanding what our “right-size” is. The most common type of right-sizing a team will do is taking their 85th percentile of their cycle time for items at story level, and using this as their “right-size”, saying 85% of items take n days or less. They then proactively manage items through Work Item Age, compared to their right-size:

Adapted from

John Coleman — Just use rightsizing, for goodness sake

However, as we are looking at planning for Features (since this is what business stakeholders care about), we need to do something different. Please note, when I say “Features”, what I really mean here is the backlog hierarchy level above User Story/Product Backlog Item. You may call this something different in your context (e.g. Epic), but for simplicity in this blog I will use the term “Feature” throughout.

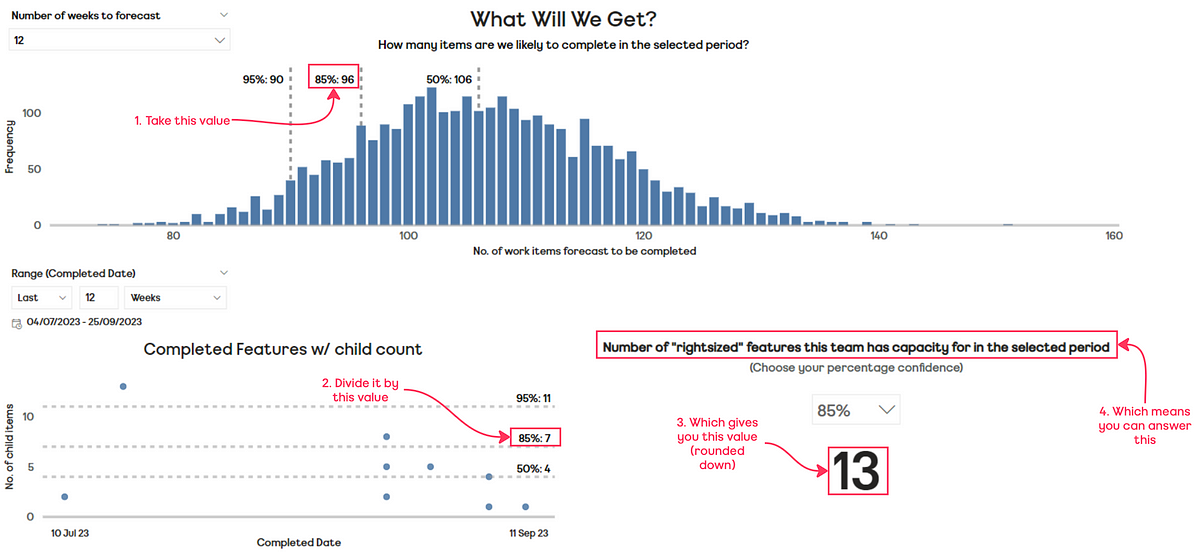
I first learnt about this method from Prateek’s “How many bottles of whiskey will I drink in 4 months?” talk from Lean Agile Global 2021. We visualise the Features completed by the team in the last n weeks, plotting them on a scatter plot with the count of completed child items (at story level) and the date the Features were completed. We then add in percentiles to show the 50th/85th/95th percentiles for size (in terms of child item count), typically taking the 85th percentile for our right-size:

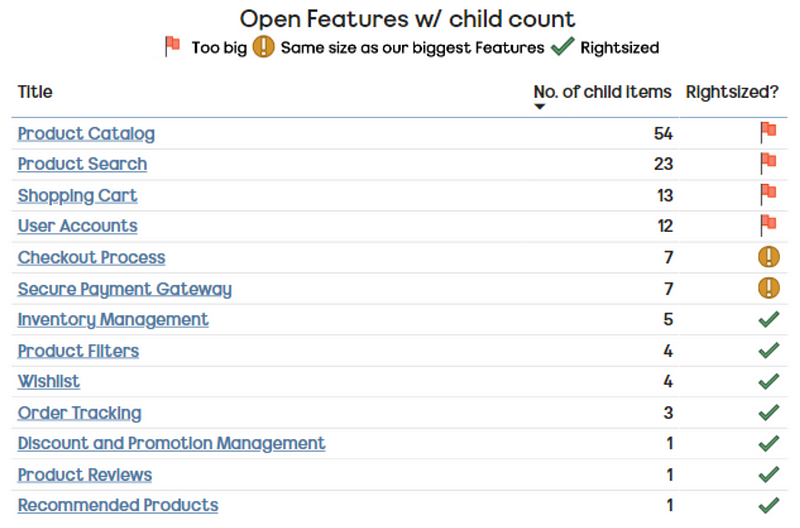
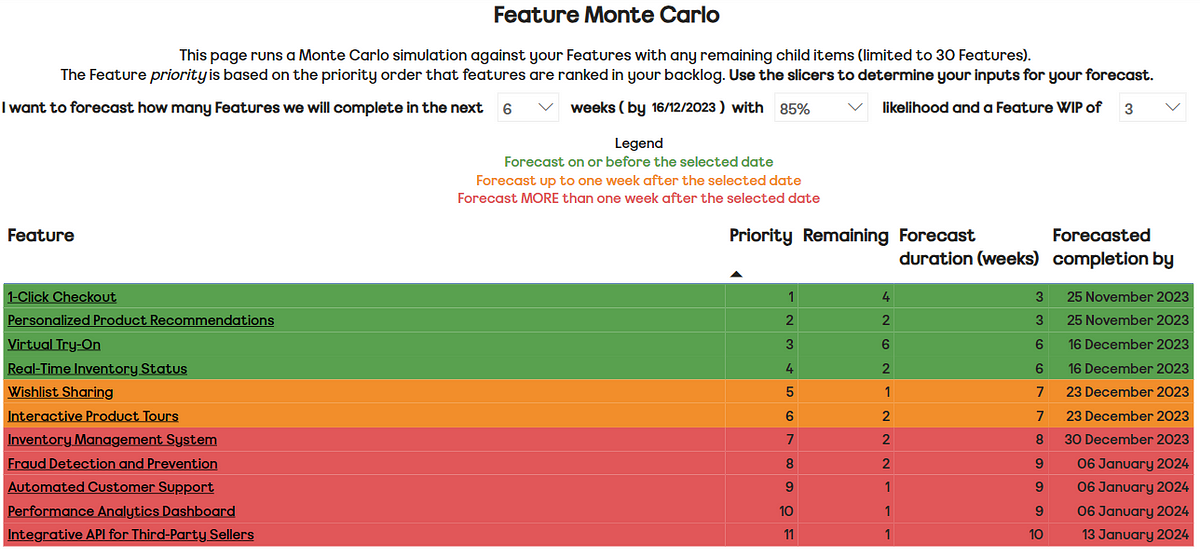
What we also do is visualise the current Features in the backlog and how they compare to the right-size value (giving this to teams ‘out the box’ we choose 85th percentile for our right-size). This way a team can quickly understand, of their current Features, which may be sized correctly (i.e. have a child item count lower than our right-size), which might be ones to watch (i.e. are the same size as our right-size) and which need breaking down (i.e. bigger than our right-size):

Please note: all Feature names are fictional for the purpose of this blog

Note that the title of the Feature is also a hyperlink for a team to open the item in their respective backlog tool (Azure DevOps or Jira), allowing them to directly take action for any changes they wish to make.

What will we get?

Now we know what our right-size for Features is, we need to figure out how many backlog items/stories we have capacity for. To do this, we are going to a run a Monte Carlo simulation to forecast how many items we will complete. I am not planning to go into detail on this approach and why it is more effective than other methods such as story points, mainly because I (and countless others!) have covered this in detail previously. We will use this to allow a team to forecast, to a percentage likelihood, the number of items the team is likely to complete in the forecasted period (in this instance 12 weeks):

It is important to note here that the historical data used as input to the forecast should contain the same mix of conditions as the future you are trying to predict. As well as this, you need to understand about the variability in your system and whether it is the right amount or too much — check out Dan Vacanti's latest book if you want more information around this. Given nearly all our teams are stable and dedicated to an application/service/part of the journey, this is generally a fair assumption for us to make.

How many Features?

Now that we have our forecast for how many items, as well as our right-size for our Features, we can calculate how many Features we have capacity for. Assuming we are using our 85th percentile, we would do this via:

  1. Taking the 85th percentile value in our ‘What will we get?’ forecast

  2. Divide this by our 85th percentile ‘right-size’ value

  3. If necessary, round this number (down)

  4. This gives us the number of ‘right-sized’ features we have capacity for

The beauty of this approach is, unlike other methods which just provide a single value in terms of capacity, with no understanding of what the risk involved with that calculation is, this method allows teams to play around with the risk appetite they have. Currently this is set to 85% but what if we were feeling more risky? For example, if we’ve paid down some tech debt recently that enables us to be more effective in delivery, then maybe 70% is better to select. Know of new joiners and people leaving your team in the coming weeks therefore need to be more risk averse? Then maybe we should be more conservative with 95%…

Tracking Feature progress

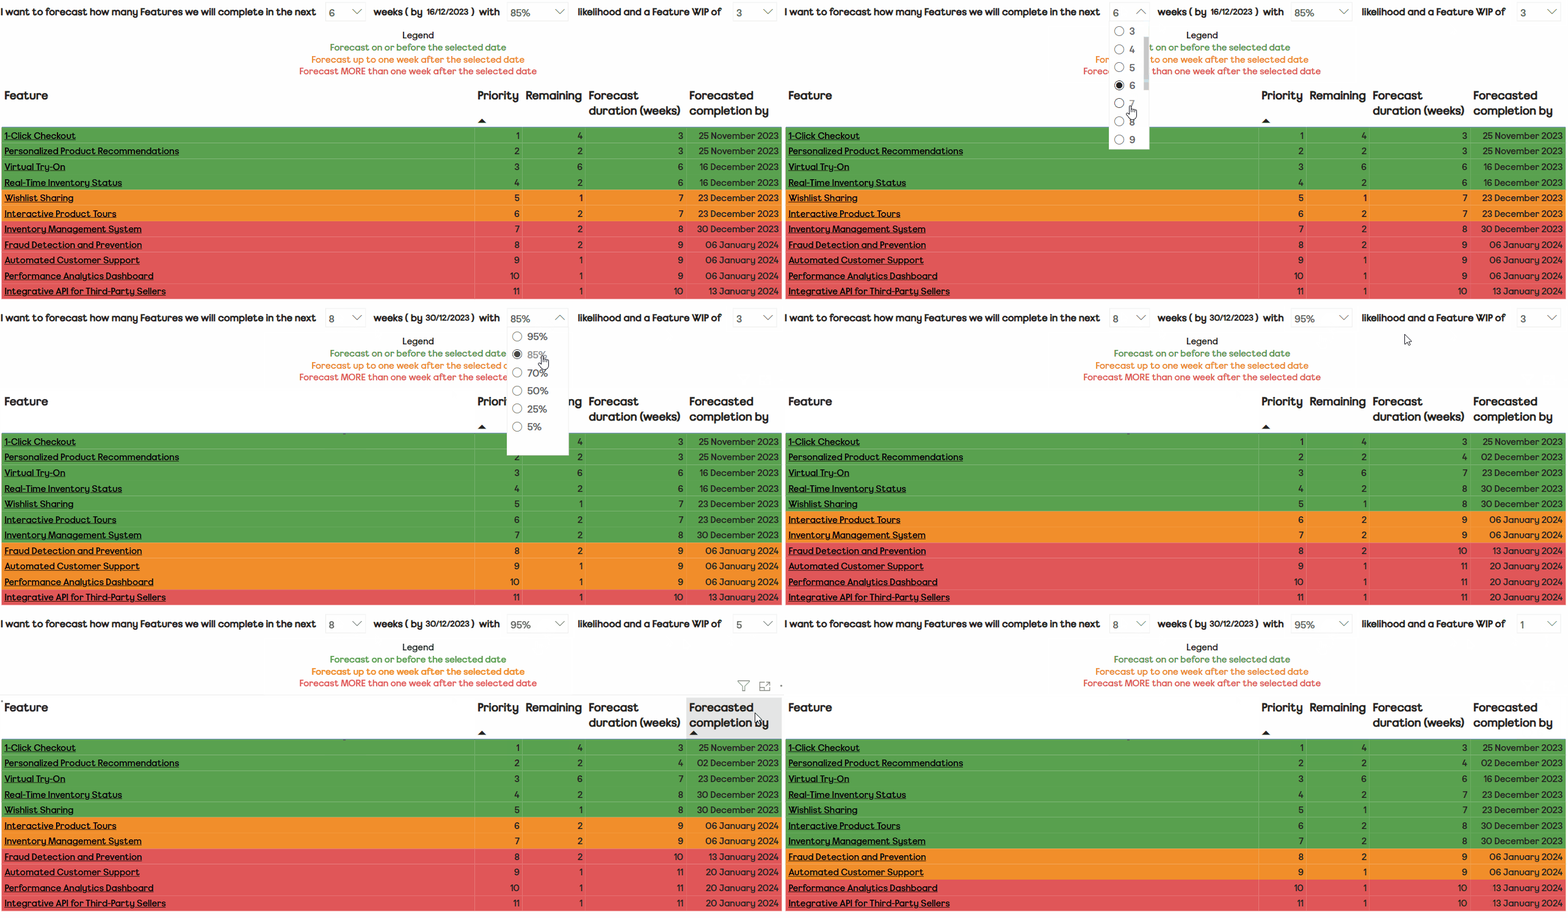
When using data for planning purposes, it is also important that we are transparent around progress with existing Features and when they are expected to complete. Another part to the template teams can use is running a Monte Carlo simulation on their current Features. We visualise Features in their priority order in the backlog along with their remaining child count, with the team able to select a target date, percentile likelihood and crucially, how many Features they work on in parallel. For a full explanation on this I recommend checking out Prateek Singhs Feature Monte Carlo blog which, combined with Troy Magennis’ multiple feature forecaster, was the basis for this chart. The Feature Monte Carlo then shows, depending on the percentage confidence chosen, which Features are likely to complete on or before the selected date, which will finish up to one week after the selected date, and which will finish more than one week after the selected date:

Please note: all Feature names are fictional for the purpose of this blog

Again, the team is able to play around with the different parameters here to understand which is the determining factor which, in almost all cases, is to limit your work in progress (WIP) — stop starting and start finishing!

Please note: all Feature names are fictional for the purpose of this blog

Aggregating information across teams

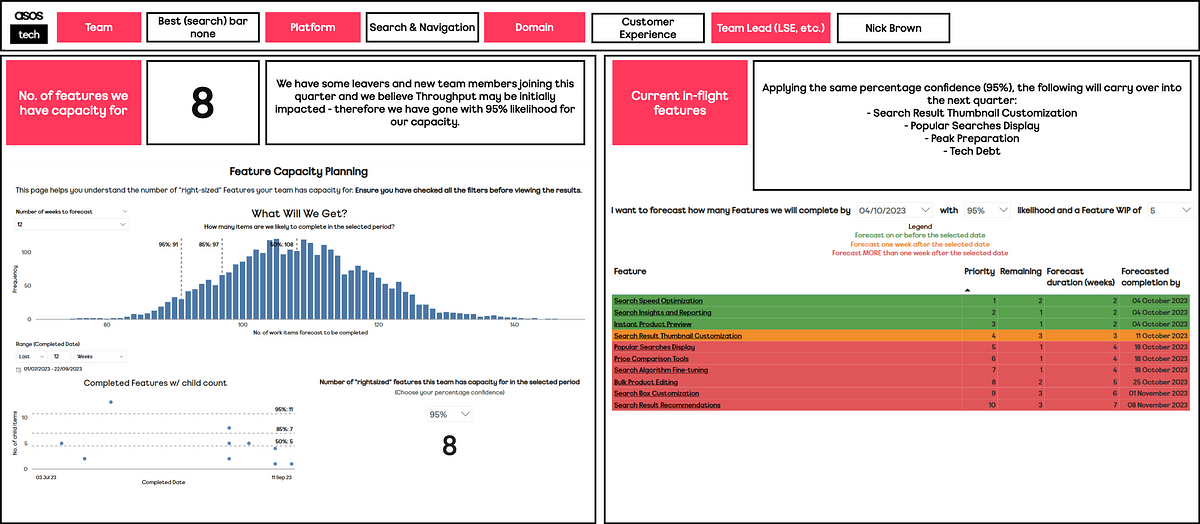
As the ASOS Tech blog has shared previously, we try to gather our teams at a cadence for our own take on quarterly planning (titled Semester Planning). We can use these techniques above to make clear what capacity a team has and, based on their current features, what may continue into another quarter and/or have scope for reprioritisation:

Capacity for 8 ‘right-sized’ features with four features that are being carried over (with their projected completion dates highlighted)

Within our technology organisation we work with a Team > Platform (multiple teams) > Domain (multiple platforms) model — a platform could therefore leverage the same information across multiple teams (in a different section of a Miro board) to present their view of capacity across teams as well as leveraging Delivery Plans to show when (in terms of dates) that capacity may be available:

Please note: all Feature names are fictional for the purpose of this blog

Domains are then also able to leverage the same information, rolling this info up one level further for a view across their Platform(s):

Please note: all Feature names are fictional for purpose of this blog

One noticeable addition at this level is the portfolio alignment value. 

This is where we look at what percentage of a Domains work is linked to our overall Portfolio Epics. These portfolio items ultimately represent the highest priorities for ASOS Tech and in turn directly align to strategic priorities, something which I have covered previously in this blog. It is therefore very important we are aware of and striking the right balance between feature delivery, the needs of our platforms and tech debt/hygiene.

These techniques allow us to present a data-informed, aligned view of capacity across our technology organisation whilst still allowing our teams the freedom in choosing their own way of working (aligned to agile principles).

Conclusion

Whilst we do not mandate a single way of working, there are some practices that need to be in place for teams/platforms to leverage this, these being:

  • Teams and platforms regularly review and move work items (User Stories, PBIs, Features, Epics, etc.) to in progress (when started) and done (once complete)

  • Teams regularly monitor the size (in terms of number of child work items) of Features

  • At all levels we always try to break work down to thin, vertical slices

  • Features are ‘owned’ by a single team (i.e. not shared across multiple teams)

All teams and platforms, regardless of Scrum, Kanban, XP, DevOps, blended methods, etc. should be doing these things already if they care about agility in their way of working.

Hopefully this blog has given some insight on how you can do capacity planning, at scale, whilst allowing your teams freedom to choose their own way of working. If you are wondering what tool(s) we use for this, we have a Power BI template that teams can download, connect to their Jira/Azure DevOps project and get the info. If you want, you can give this a go with your team(s) via the GitHub repo here(don’t forget to check against the pre-requisites!).

Let me know in the comments if you have any other approaches for capacity planning that allow teams freedom in their way of working…

Weeknotes #39

Agile not WAgile

This week we’ve been reviewing a number of our projects that are tagged as being delivered using Agile ways of working within our main delivery portfolio. Whilst we ultimately do want to shift from project to product, we recognise that right now we’re still doing a lot of ‘project-y’ style of delivery, and that this will never completely go away. So we’re trying to in parallel at least get people familiar with what Agile delivery is all about, even if delivering from a project perspective.
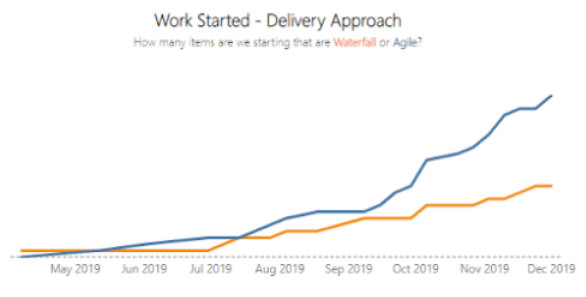
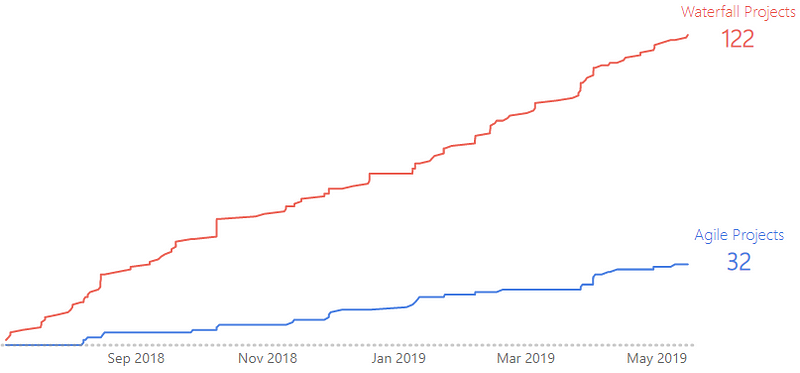
The catalyst really for this was one of our charts where we look at the work being started and the split between which of that is Agile (blue line) Vs. Waterfall (orange line).

The aspiration being of course that with a strategic goal to be ‘agile by default’ the chart should indeed look something like it does here, with the orange line only slightly creeping up when needed but generally people looking to adopt Agile as much as they can.

When I saw the chart looking like the above last week I must admit, I got suspicious! I felt that we definitely were not noticing the changes in behaviours, mindset and outcomes that the chart would suggest, which prompted a more thorough review.

The review was not intended to act as the Agile police(!), as we very much want to help people in moving to new ways of working, but to really make sure people had understood correctly around what Agile at its core really is about, and if they are indeed doing that as part of their projects.

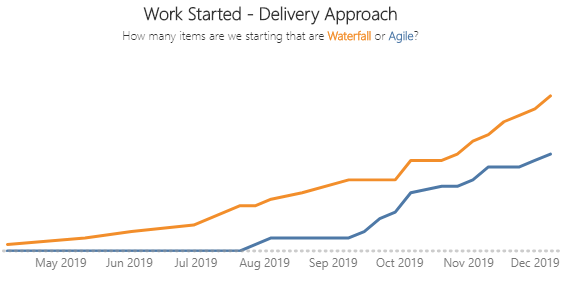
The review is still ongoing, but currently it looks like so (changing the waterfall/agile field retrospectively updates the chart):

The main problems observed being things such as lack of frequent delivery, with project teams still doing one big deployment to production at the end before going ‘live’ (but lots of deployments to test environments). Projects are maybe using tools such as Azure DevOps and some form of Agile events (maybe daily scrums), but work is still being delivered in phases (Dev / Test / UAT / Live). As well as this, a common theme was not getting early feedback and changing direction/priorities based on that (hardly a surprise if you are infrequently getting stuff into production!).

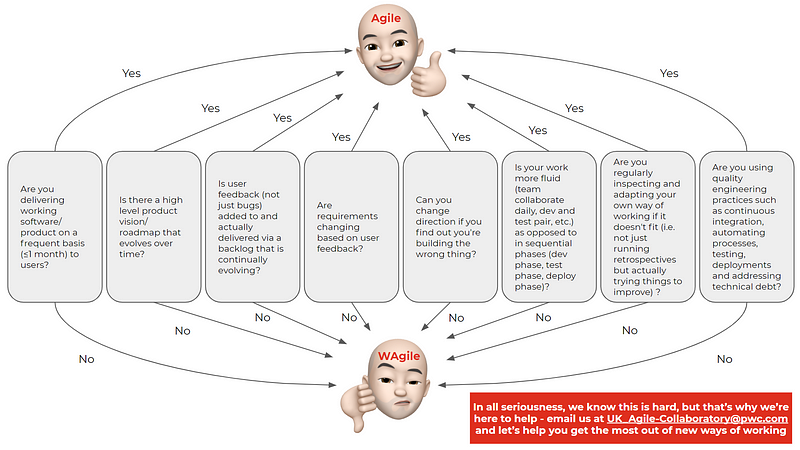
Inspired by the Agile BS detector from the US Department of Defense, I prepared a one-pager to help people quickly understand if their application of Agile to their projects is right, or if they need to rethink their approach:

Here’s hoping the blue line goes up, but against some of that criteria above, or at least we get more people approaching us for help in how to get there.

Team Health Check

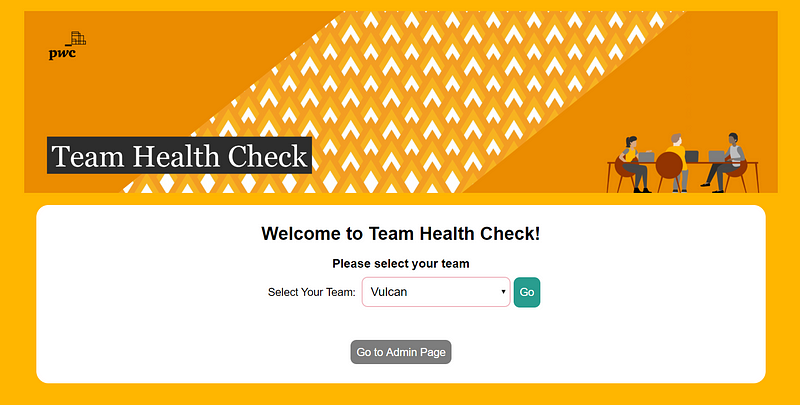
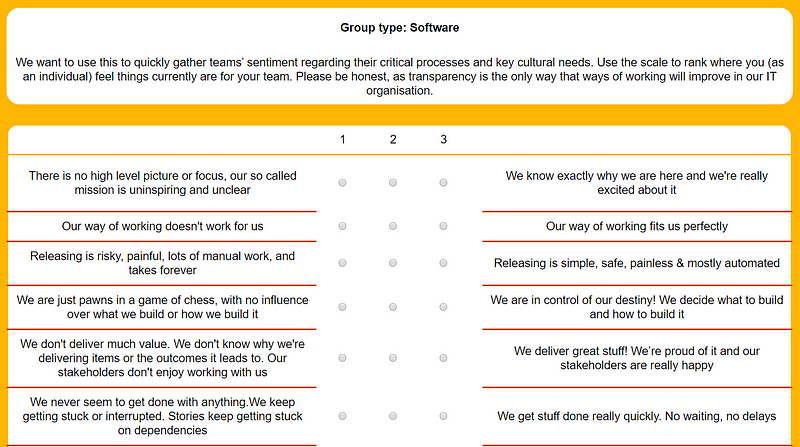
This week we had our sprint review for the project our grads are working on, helping develop a team health check web app for teams to conduct monthly self assessments as to different areas of team needs and ways of working.

Again, I was blown away by what the team had managed to achieve this sprint. Not only had they managed to go from a very basic, black and white version of the app to a fully PwC branded version.

They’ve also successfully worked with Dave (aka DevOps Dave) to configure a full CI/CD pipeline for any future changes made. As the PO for the project I’ll now be in control of any future releases via the release gate in Azure DevOps, very impressive stuff! Hopefully now we can share more widely and get teams using it.

Next Week

Next week will be the last weeknotes for a few weeks, whilst we all recharge and eat lots over Christmas. Looking at finalising training for the new year and getting a run through from Rachel in our team of our new Product Management course!

Weeknotes #35

Back to Dubai

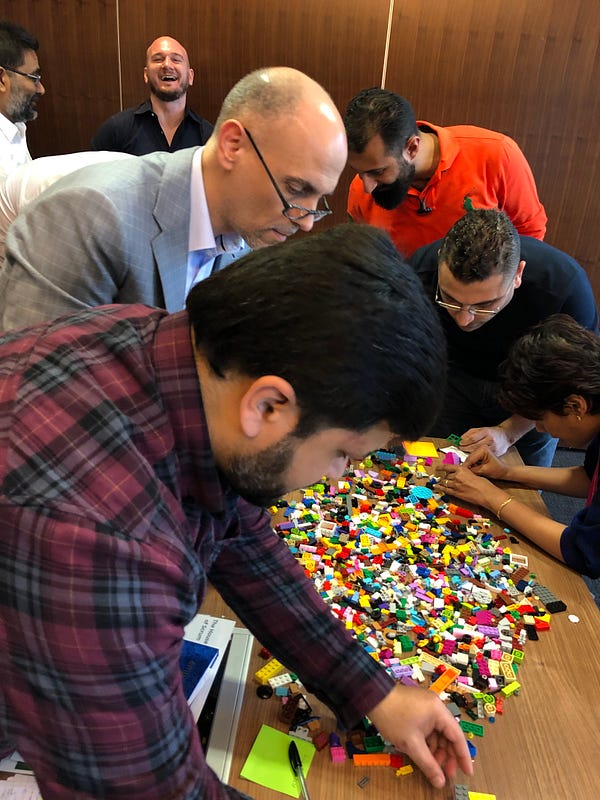
This week I was out in the Middle East again, running back to back Agile Foundations training sessions for people in our PwC Middle East firm. 

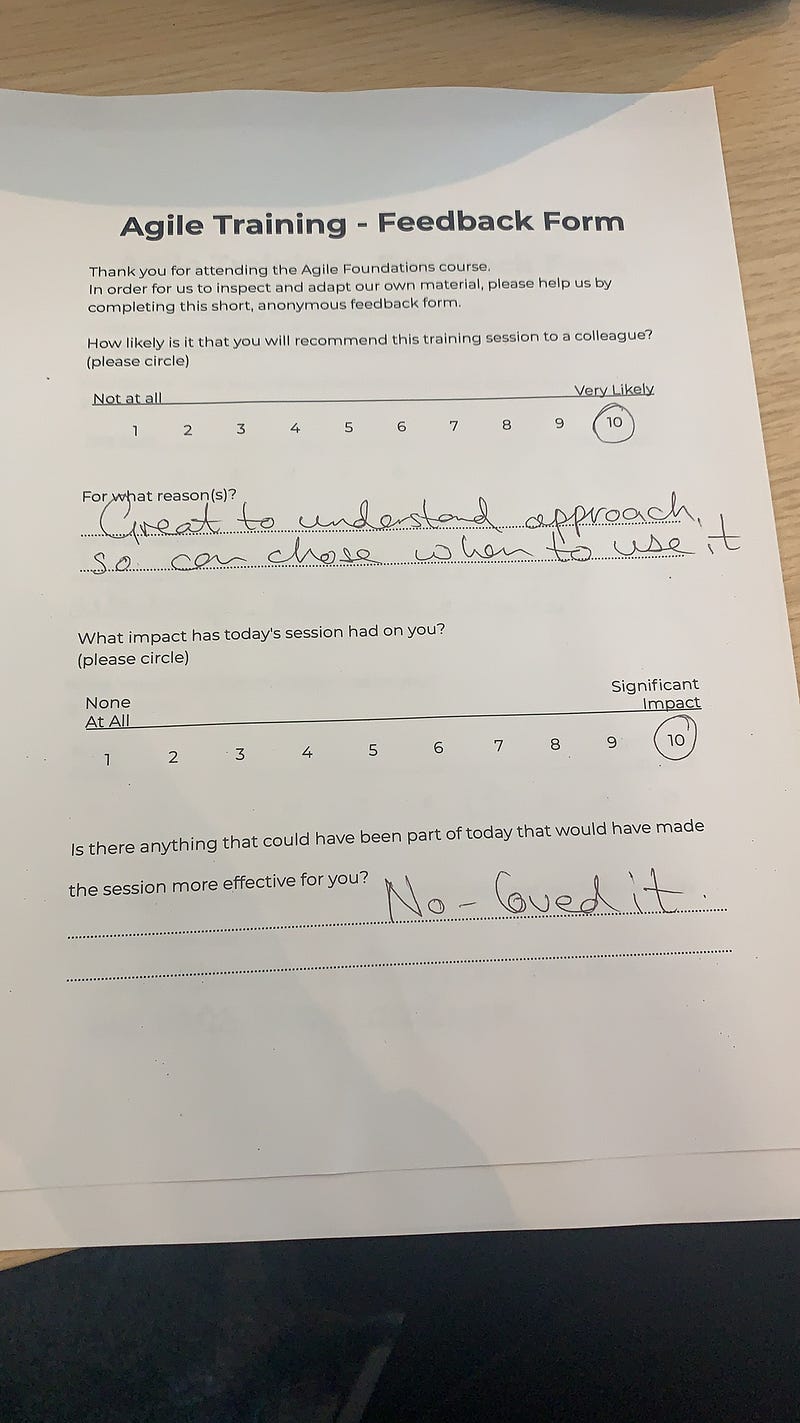
I had lots of fun, and it looked like attendees did too, both with the engagement on the day and the course feedback I received.

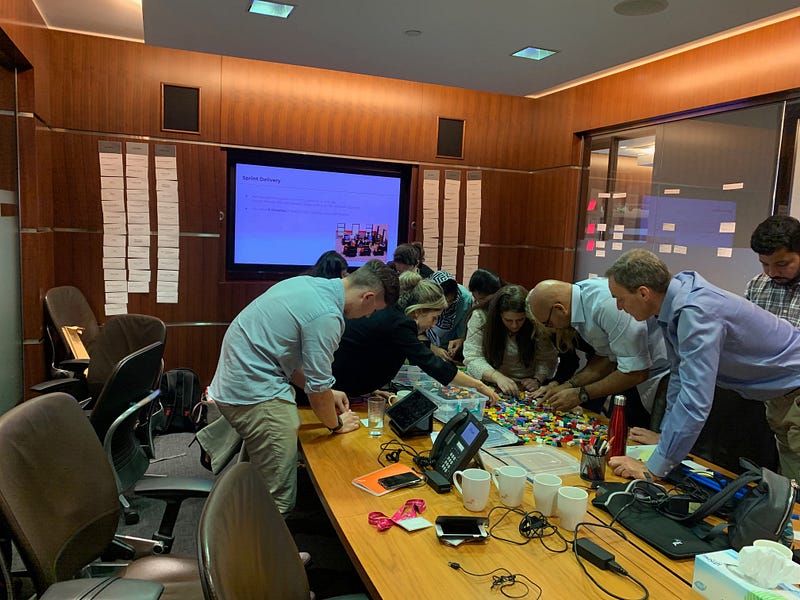
One issue with running training sessions in a firm like ours are that a number of large meeting rooms still have that legacy “boardroom” format, which means for little movement during sessions that require interaction. Last time I was there this wasn’t always the case, as one room was in the academy which, as you can tell by the title was a bit more conducive to collaboration. As well as that we had 12 people attend on day one, but 14 attendees on day two which again for me is probably two people too many. Whilst it generally works ok in the earlier parts of the day as the room can break off into two groups, it causes quite a lot of chaos when it comes to the lego4scrum simulation later on, as we really only have enough lego for one group. Combine that with the room layout and you can understand why some people can go off and get distracted/talk amongst themselves, but then again maybe that’s a challenge for the Scrum Master in the simulation! A learning for me is to limit it to 12 attendees max, with a preference to smaller (8–10) audience sizes.
Retrospectives

I’ve talked before around my view on retrospectives, and how they can be mistreated by those who act as the ‘agile police’ by using their occurance to determine if a team is/is not Agile (i.e. “thou cannot be agile if thou is not running retrospectives”). This week we’ve had some further contact from our Continuous Improvement Group around the topic and how to encourage more people to conduct them. Now, given this initiative has been going on for some time, I feel that we’ve done enough around encouragement and providing assistance/coaching to people if needed. We’ve run mock retrospectives, put together lengthy guidance documents with templates/tools for people to use, people practice it in the training on multiple occasions yet there are still only a small amount of people doing them. Given a key principle we have is invitation over infliction, this highlights that the interest isn’t currently there, and that’s ok! This is one in a list of many ‘invitations’ there are for people to start their agile journey — if the invitation is not accepted then ok, let’s try a different aspect of Agile.

A more important point for me really is that just because you are having retrospectives, it does not always mean you are continuously improving.

If it’s a moan every 1–4 weeks, that’s not continuous improvement. 

If nothing actionable or measurable comes out of it that is then reviewed at the next retro, then it’s not continuous improvement. 

If it’s held too infrequently, then it’s not continuous improvement.

With Toyota’s Kentucky factory pulling on the andon cord on average 5,000 times a day, this is what continuous improvement is! Worth all of us as practitioners remembering that running a retrospective ≠ Continuous Improvement.

Next Week

Next week we have a review with ICAgile, to gain course accreditation to start offering a 2-day training course with a formal ICAgile Fundamentals certification. It’s been interesting putting the course together and mapping it to official learning outcomes to validate attendees getting the certification. Fingers crossed all goes well and we can run a session before Christmas!

Weeknotes #33

Right to Left

This week I finished reading Mike Burrows’ latest book Right to Left

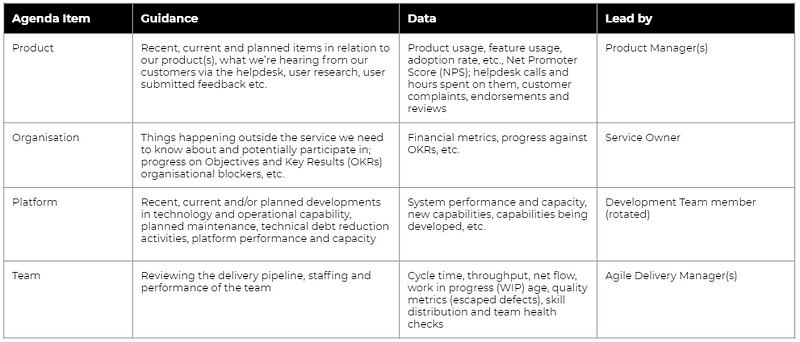
Yet again Mike manages to expertly tie together numerous aspects of Agile, Lean and everything else, in a manner that’s easy to digest and understandable from a reader/practitioner perspective. One of my favourite sections of the book is the concept of the ‘Outside-In’ Service Delivery Review. As you can imagine from the title of the book, it’s taking the perspective of the right (needs, outcomes, etc.) as an input, over the left (roles, events, etc.) and then applying this thinking across the board, say for example in the Service Delivery Review meeting. This is really handy for where we are on our own journey, as we emphasise the need to focus on outcomes in grouping and moving to product teams that provide a service to the organisation. One area of this being around how you construct the agenda of a service review. 

I’ve slightly tweaked Mikes take on matters, but most of the format/wording is still the same:

With a Service Review coming soon, the hope is that we can start adopting this format as a loose agenda going forward, in particular due to it’s right to left perspective.

Formulating the above has also helped with clarity around the different events and cadences we want teams to be thinking about in choosing their own ways of working. I’ve always been a fan of the kanban cadences and their inputs/outputs into each other:

However I wanted to tweak this again to be a bit simpler, to be relevant to more teams and to align with some of what teams are already doing currently. Sonya Siderova has a nice addition to the above with some overarching themes for each meeting, which again I’ve tailored based on our context:

These will obviously vary depending on what level (team/service) we’re focusing on, but my hope is something like the image above will give teams a bit clearer steer as to things they should be thinking about and the intended purpose of them.

Digital Accelerators

We had another session for our Digital Accelerators this week, which seemed to be very well received by our attendees. We did make a couple changes for this one based on the feedback from last week, removing 2–3 slides and changing the Bad Breath MVP exercise from 2 groups to 4 groups. 

It’s amazing how much a little tweak can make, as it did feel like it flowed a lot easier this time, with plenty opportunity for people to ask questions. 

Last weeks session was apparently one of the highest scoring ones across the whole week (and apparently received the biggest cheer when the recap video showed photos of people playing the ball point game!), with a feedback score of 4.38/5 — hopefully these small changes lead to an even higher score once we get the feedback!

Next Week

Next week is a quieter one, with a trip to Manchester on Tuesday to meet Dave, our new DevOps Engineer, as well as help coach one of our teams around ‘Product’ thinking with one of our larger IT projects at the minute. Looking forward to some different types of challenges there, and how we can start growing that product management capability.

Weeknotes #21

Personal Kanban

I started this week by running a little bit of an experiment, using Kanbanchi as a personal kanban tool for the week. We’re current trialling the product with different teams, mainly as it nicely integrates with G Suite. It’s easy to get started, and once I’d created a board I mapped out my workflow (of course using WIP limits as well) of:

To Do This Week | To Do Today | Doing | Done (Awaiting Feedback) | Done

After that, I set myself a 15 minute daily standup at 7:30 each morning, to review my board and make a plan for the day. Much like when you work with new teams, you don’t quite realise how many things you’re doing (or things that are half done!) till you start to make it visible.

They’ve also recently added some metrics to the product as well which, for those that know me will be aware of, are something I’m very passionate about. Here is a look at my CFD for the week as of this morning:

Overall, I found it pretty useful and something I’ll look to stick with in the future. Nothing like eating your own dog food!

Continuous Everything

This week we ran a workshop to start to define how support would work in our new ‘Product’ world. With the traditional hand-off from Dev to Ops (throwing over the fence?), the conversation was all around how we bring these two groups together, in particular looking at some of our pilot product teams we’re working with at the minute and how we can incrementally introduce that in. It was good to have a number of the roles in teams already prepared to explain to a wider group, as it helped provide context around what outcomes we’re trying to achieve, plus the chance for us to get feedback around if they actually make sense. Whilst there’s no doubting there will be teething problems/learning, the good thing was that everyone came away positive and with a shared understanding on how we want things to work. Simon from the Operations side did a great job in facilitating, in particular by involving not only those of us on the Agile side, but also our supplier (for the pilot team) and procurement in the conversation. With this adoption of new ways of working, it is clear that everything now moves to being continuous. Not just continuous integration and delivery, but also continuous compliance, continuous support and ultimately, continuous transformation. There is no ‘end state’ and teams should now be constantly looking to experiment, learn and evolve their own ways of working.

Agile Outside IT

The Assurance Digital Audit team had a bit of a soft launch this week in their Agile adoption, which I attended along with their core team based in London. The team are taking a pragmatic approach to Agile adoption, using kanban boards at Project > Deliverable > Product Backlog Item (PBI) > Task level depending on your role in the team, combined with daily scrums to start with. What’s been great so far is the recognition that full blown Scrum is probably not right for their context currently, but they have expressed a desire to incrementally get there. The team have taken to it really well so far, with myself just needing to sow the seeds every now and then around what the principles of Agile are, gently steering them if they start to go off track. It will be interesting to see how the next few weeks/month play out, with a plan for a UK wide adoption based on the outcomes of piloting it in London.

Next Week

I’ll be starting next week off with a discussion around Machine Learning in an Agile world, with a team interested in learning more and applying the practices relevant to their context with the work they do in Assurance. We’ve also got a long overdue team night out planned for Wednesday at Swingers Mini Golf — looking forward to a few drinks, great company and hopefully not too many sore heads (and bruised egos after the mini golf?) the next day.

Weeknotes #18

Scaling OKRs

After a year of experimenting with OKRs, we’re getting a lot better as a team in setting achievable and ambitious objectives and key results for the quarter. The approach appears to be working, as this week our help was requested by a member of our IT leadership in helping set OKRs for five other teams across our IT department. This presents a new challenge for us, in that we’ll get to learn about scaling OKRs and how we can use them across multiple teams to create departmental (and scaling to organisational) alignment. With the fact that the key results are SMART in their nature, it should also mean personal objective setting is a lot easier for people. I know this is something a number of people (including myself) find difficult, so if we can introduce something that makes this easier then it’s another potential win for our team.

Agile Assurance

I had some good conversations this week with multiple people in our Assurance team who wanted to learn about applying Agile either to their own work internally or developing further offerings to assist clients. 

It makes sense why an offering around an empirical, data-driven approach would appeal to clients, as well as the fact it’s focused on the roots of Agile around empiricism and transparency. An interesting learning for me in our conversations was just around how many misconceptions there are when it comes to metrics/measurements for teams to use. The language used such as ‘Items committed Vs. Items delivered’ or ‘Estimate Accuracy’ are almost all set out with a bias of ‘it must be the teams fault’ — rather than looking at underlying system symptoms, as well as focusing on outcomes. 

A good few hours coaching however managed to reset some of these misconceptions, so I’m looking forward to the next steps in us developing something that will ultimately aid organisational agility.

One of the partners in one of our business lines for Assurance seems dedicated to adopting Agile within his team(s), which was great to hear. So often it feels like our role is around convincing people why Agile is the right fit for them, whereas this was very much one centered on the how, rather than the why. We pickup again first thing Monday morning (I love a sense of urgency!) and already I’ve got lots of ideas in how we can help them adopt a pragmatic, flow based way of working based on Agile principles.

The Dip

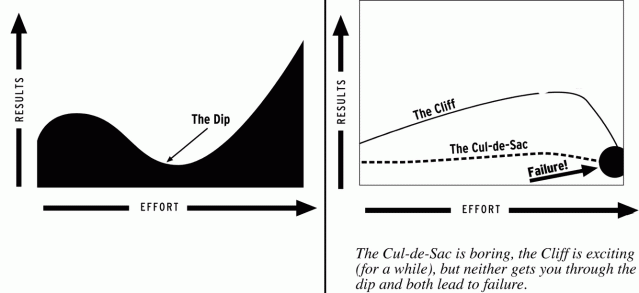
This week I started reading The Dip, a short book by Seth Godin. The book explains how you might be in a dip, which may get better if you persevere, or that you may get stuck, and it will never get better no matter what you do.

According to the book, Winners quit fast, quit often and quit without guilt — until they commit to beating the right dip for the right reasons. It’s a good short read, and useful for anyone going through wider change programmes, who may need some supporting reading around the dip they may be in.

Next Week

Next week I’ll be recording a podcast with a couple of my colleagues on ‘bringing goals to life’. Given one of our three goals for this performance year is around taking an ‘agile by default’ approach, we want to give people some assistance and (hopefully!) inspiration around what that means and how everyone can help contribute towards us achieving our goals.

Weeknotes #17

We on award tour

As I mentioned before I went away, our team had been shortlisted for the Make a difference award for our IT awards. After an amazing two weeks away it was great to come back refreshed but also to have this:

It’s a testimony to the people in our team that we’ve been recognised with an award, and I’m incredibly thankful to all of them for a great year, hoping for a repeat in the next performance year.

Complex = Waterfall (🙄)

Another discussion this week has been around when to use Waterfall vs when to use Agile. Now this is a common discussion point for us at the moment, in particular with the current approach we are experimenting with being ‘agile by default’ with people needing to prove why Waterfall is a better fit for delivery. Our approach has been on a case-by-case basis, preferring conversation with individuals over a computer generated answer.

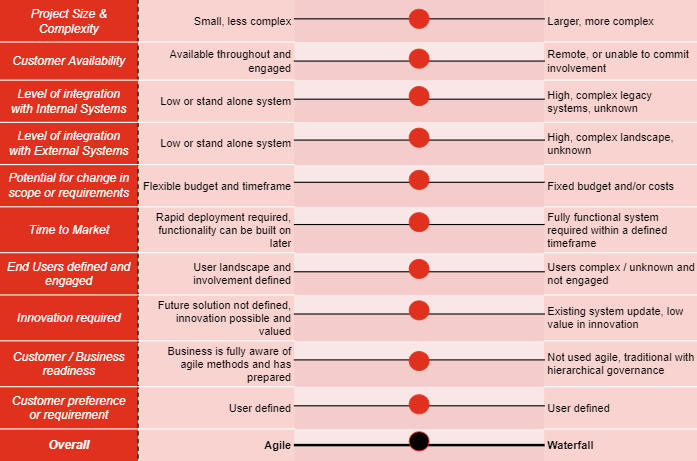
A document was passed our way as to some guidelines for when to use Waterfall or when to use Agile:

The major problem I have with things like this, is that they are similar to maturity models in their ‘one size fits all’ approach, and heavily favoured as revenue generators for consultants. They look to get away from conversation by getting a system generated answer, with little appreciation of context. 

The most baffling aspect on this particular one is alluding to that if it’s a complex product, where users are unknown, then waterfall is the best fit.

Perhaps it’s best for the creators to take a look at page 3 of the Scrum Guide:

Purpose of the Scrum Guide

Scrum is a framework for developing, delivering, and sustaining complex products.

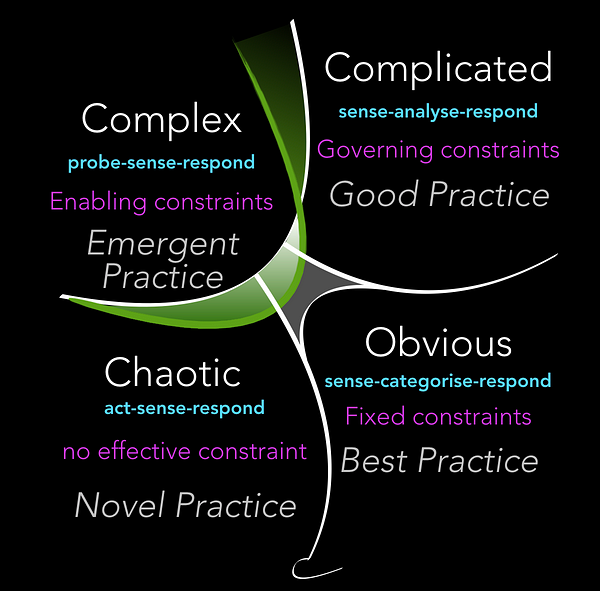
This is where another useful tool in the practitioner toolkit is having familiarity with Cynefin.

Cynefin offers five decision-making contexts or “domains” — obvious (known until 2014 as simple), complicated, complex, chaotic, and disorder — that help managers to identify how they perceive situations and make sense of their own and other people’s behaviour.

Complex in particular is a domain that represents the “unknown unknowns”. Cause and effect can only be deduced in retrospect, and there are no right answers.

The notion of being in a complex domain and therefore waterfall being the only sensible approach is clearly flawed. Similarly the idea around ‘best practices’ for Agile also being an oxymoron.

Ultimately, regardless of approach to delivery, we should all try to remember this from Jeff Gothelf:

Every project does not have to be Agile. However, each project you work on should encourage and support agility.

Reviewing OKRs

With us coming to the end of the first quarter in our performance year, today we had a review of our OKRs as a team.

Overall, I think we were all quite pleased with the outcomes. In particular the 32% reduction in cycle time at portfolio level shows the impact introducing (and sticking to) WIP limits has had. Unfortunately it looks like a few things we’ve neglected or we were maybe too ambitious in setting as key results we looked to achieve. All useful in informing the direction we need to go for the next quarter.

Next week

Next week I’ve got a few discussions planned with other coaches in the different business lines we have, so looking forward to hearing what’s going on in their areas. I also have a workshop myself and others in our team have been invited to which is tentatively titled as “Agile session for digital audit” — currently I’ve not had any briefing so prepared for an interesting session!

Weeknotes #16

Reward and recognition

This week, I was really pleased to see that our team have been shortlisted for the Make a difference award for our IT awards on 17th June:

Reward and recognition are tough subjects when playing the role of coaches and/or change agents. We all want to be rewarded/recognised for driving a wider change but we can often end up failing to get recognised with the ‘old’ behaviours still rewarded, this then tests your own ability to continue driving the wider change, as well as not be perceived as bias by those rewarding the wrong behaviours. Individual reward conversations are happening in the next few weeks so it will be interesting to see what has been recognised as leading by example, in particular with our strategic shift at the end of November to move towards more Agile ways of working. Hopefully the right behaviours have been recognised, otherwise my fear is that the sense of urgency will not be created if we still reward business-as-usual, big batch projects, year-long delivery cycles.

Training Day

On Wednesday I ran a one-day Foundations session for fellow IT staff in our Manchester office. This was the first one we’d run for IT people in the UK where we have switched up the format, replacing Featureban with lego4Scrum to get more of a feel for simulated delivery in an Agile world.

Feedback was positive across the board, which is good to know given the changes made. I’m a big fan of lego4Scrum, mainly due to its potential variability in outcomes (plus the fact it’s lego!). I’d like to give Featureban 3.0 a go, but

FlowViz

With some time to myself after flaky wifi (Virgin Trains 👀) on the train to/from Manchester and then up to Newcastle on Thursday, I set about refactoring FlowViz, given the API is now up to v3.0 (I built it using v1.0). 

It’s good to see the Azure DevOps team making more data such as builds, pipelines and test items available…although when looking through the data I was struggling to see what additions I could make with the new information. Ideally I’d like to bring in the 4 Software Delivery Performance metrics from DORA, alas this currently looks to be unavailable.

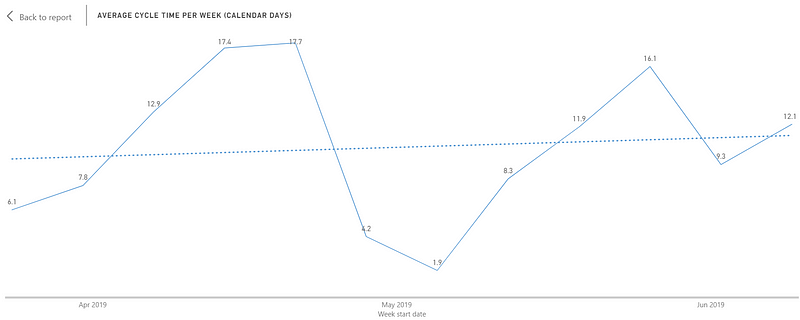
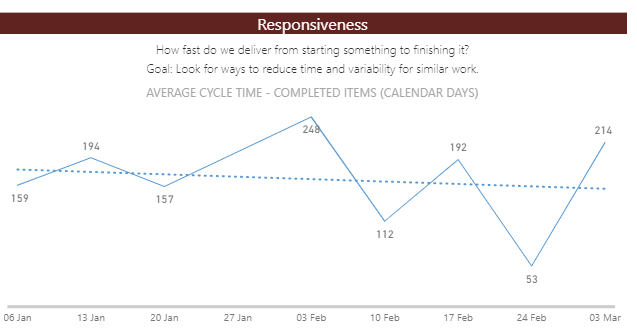
In any case, I made a number of tweaks, updating the endpoint to use both the new URL format (dev.azure.com) and the v3.0-preview of the API, as well as creating a few new charts for teams to use. With Power BI * still * (to my disbelief and frustration) unable to handle date on the x-axis without aggregating I’ve moved to using average cycle time per week with a trend line to see if we’re on the right path.

Wrong direction team!

I actually did this for existing teams a couple of months ago, so was quite pleased to see Troy’s new team dashboard having the same chart added a few weeks ago. Made me smile that my own thinking was in-line with someone far more experienced than myself.

Other charts added/updates include:

- Layout changes/new modern visual header

- In-Progress Item Age (Calendar Days)

- Stale Work (Days since item updated)

- Cumulative Flow by Day

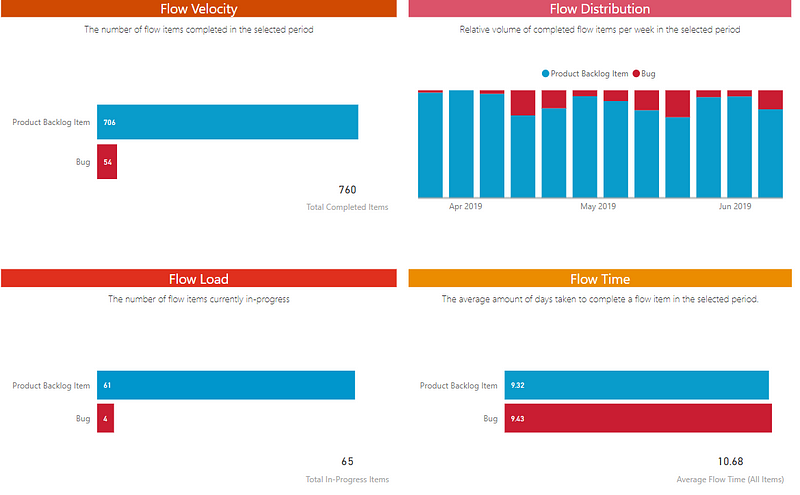
I also made an attempt at the Tasktop flow metrics that get a frequent mention in Project to Product:

Nowhere near as good however feedback from others has been that they really like the ‘clean’ design — hopefully it’s a simpler way to present information that teams can start to leverage.

Check the link here for the free download.

Next week (or next few weeks)

Next week I’ll only be in the office on Monday morning, then taking an extended break till 3rd July. On Monday night myself and my fiancée will be flying out to Bali (not Hotel K — but thanks Jon for the book suggestion) for two weeks of relaxing and travelling. Of course, this means I’ll be taking a hiatus from Weeknotes till I’m back, so look out for Weeknotes #17 on 5th July.

Weeknotes #14

The rewards of coaching

Recently I’ve started working with one of our Project Managers who is working towards obtaining her Professional Scrum Master (PSM1) certification. We have a fortnightly catch up (which we had this week) where we run through different aspects of Scrum and how it relates to the reality she is experiencing with the teams she is working with.

What’s been great from my side has been the conversations we’ve been having have not been centered on ‘passing the exam’, they’ve been on checking her understanding of the framework and then how reality differs from that. 

As well as that, it’s really enjoyable to hear her identify where potential improvements/changes could be made to her current context and to ask questions about an idea around an approach, as that shows the learning is landing. It’s these types of discussions where I feel the most satisfaction from a coaching perspective , as you can see how the individual you are working with is understanding and growing their own curiosity, in particular through practical application of the newly acquired knowledge. 

If she’s reading this, a thank you to her for making the past few weeks really enjoyable from a work perspective.

Scrum

This week I talked to a fellow coach for one of our vendors about concerns I had in the way a particular team was practicing Scrum. There were a number of things observable just from a quick browse of the team area/board that stood out to me as being anti-patterns or just bad practices being inflicted on a team new to their Agile journey. It still amazes me over the years how people still persist with techniques that are quite outdated/never actually within the Scrum Guide. Now, I will fully admit that in my own Agile journey I was once the same in that I used to believe commitment to x number of backlog items, story points and velocity were of paramount importance, however after reading/learning more and experimenting, I’ve got my own list on what modern day Scrum looks like. That list includes (assuming you’re nailing your events and sticking to scrum values):

  • Tasks are optional

  • Anti-pattern — tasks in hours, or for that matter any individual measurement of hours per tasks

  • Anti-pattern — Reporting on a per individual basis — names on a dashboard are a no-no

  • Kanban boards are a must, and should reflect the end to end flow of value (i.e. they don’t stop at “UAT”, Done = Live)

  • WIP limits are a must

  • Sprint goals are short and ideally measureable; anti-patterns are long and ambiguous sprint goals

  • Story points are optional for the team only, should not be used for any forecasting/predicting (Average velocity must die)

  • Prediction on dates/scope should use monte carlo simulation or have an attributed percentage likelihood of outcome (which we know will change)

  • Continuous everything — refinement, exploration, compliance, testing, integration & delivery

  • Other sensible metrics to use would be:

  • - Work item age, cycle/lead time, net flow, throughput, lead time for change, deployment frequency, change failure rate, time to restore service, team health check, no. of experiments

Source: 4 Key Flow Metrics and how to use them in Scrum’s events by Yuval Yeret

Those of you who will have studied and/or taken the Scrum with Kanban course will notice the vast majority of my thoughts are the same as what is echoed in that material. For our teams practicing Scrum, this is what I’d expect them to work towards…ideally without being ‘forced’ through the old training wheels of story points, velocity, hours breakdown etc.

Product Metrics

One thing I’ve always found difficult are product metrics for internal developed products.

Doc Norton has recently updated the final version of his ‘Escape Velocity’ book which I re-read this week. The book has an excellent chapter on what good product/outcome metrics you could potentially use that are much more meaningful than velocity.

Based on what I’ve read, as we transition more teams from project -> product, key metrics for our teams are going to be:

- Feature usage

- Adoption Rate

- Growth rate

- Relative Feature Adoption Rate

- Retention Rate

Next week

Next week we’re running a two-day DevOps People & Process workshop with Microsoft, which should be really interesting. As a team we were a bit taken aback by the overwhelming response for people who wanted to go, so I thought it better to give up my spot on the session for someone else. 

I’m also heading to an event on Thursday which is hosted by IDC and Slack on A Framework for Agile Collaboration — should be some interesting discussion around the organisational culture and change.

Weeknotes #12

Personal Development

Unfortunately I was unable to attend the Pluralsight event I mentioned last week, so I made use of the free slots in the calendar to take a couple other exams/certifications on my list — Scrum.org’s Professional Agile Leadership (PAL) and Professional Scrum Developer (PSD).

The PAL certification in particular was quite interesting. It’s relatively new and according to Scrum.org:

The Professional Agile Leadership (PAL I) assessment is available to anyone who wishes to validate that you are a leader who understands that being Agile adds value to your business, and why leadership understanding, sponsorship, and support of Agile practices are essential to an organization becoming more agile.

I’ve touched on certifications before in previous weeknotes, and how for myself I view them as a validation of knowledge as well as a chance to see how the reality we experience relates to the theory one is taught/reads about. 

I was pleased to pass both however I would definitely say the PAL was at the harder end of the scale for exams I’ve taken, mainly as the ‘choose the best answer’ format makes it a bit tougher. There were some really challenging questions which even process of elimination didn’t immediately point to a single answer. For leaders I’d highly encourage this before you consider looking at something like a Leading SAFe certification (if you’re starting to adopt Agile ways of working), as this very much is focused on how you, as a leader, can really add value in an Agile organisation with application to real scenarios you are likely to face.

Agile by default

This week I did a bit of analysis of completed work this year in our IT portfolio and the split between traditional (waterfall) and agile methods:

With only 21% having been delivered using Agile methods it’s clear we have work to do. An experiment we want to try now is to have projects coming through as ‘agile by default’, whereby it should be delivered in an Agile way unless a good case can be made otherwise for it not to be. This could be for example if your requirements are known and will not change, COTS solutions where no changes/customisations are needed, or if there is no desire from the customer to get something of value early.

What defines if something is ‘Agile’? 

For where we are currently (not the end state) we would look for daily standups, retrospectives with continuous improvement items, a backlog, a physical/digital kanban board, a definition of done (DoD) and to be working towards technical excellence (CI/CD, automated testing, etc.). 

Agile ≠ Scrum so we want to be pragmatic with people on the journey, helping them apply as much of the above as they can where relevant.

Hopefully we can start to see those lines get closer together with this experiment…

Technical Excellence

As we know from Accelerate, technical practices directly predict or impact organizational performance and culture. This week Jon gave the rest of the team a demo on his deployment pipeline he’d built in Azure DevOps. There were a few issues he faced which weren’t ideal (all outside his own control), but this is the nature of a big organisation, sometimes changes are made at a group policy level that are going to impact the work we do.

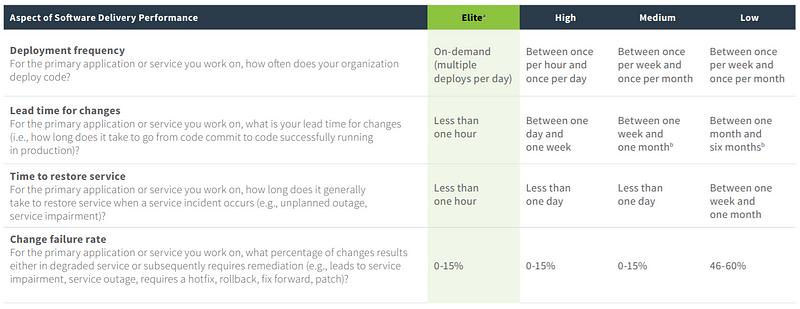
We’re still a low performing organisation particularly for deployment frequency and lead time for change however we are getting there.

A team both Jon and James are working with are now doing daytime production deployments post sprint review, and with us hooking this in to ServiceNow, we’re gradually stripping away the reasons for not being able to be Agile. I am thankful to both of them for reimagining the possible.

As General Stan McChrystal says, take away the excuses:

[embed]https://vimeo.com/203601845[/embed]

Next week

Next week I’m hoping to finalise the first two or three of our core dedicated ‘product’ teams, as we start the shift towards product over project. It will need to be a blend of permanent and supplier individuals, so a good test for how we want our future model to work. I’ll also be starting some one-to-one sessions with someone who is working towards a Scrum Master certification. I haven’t worked with this person much in the past so looking forward to starting that journey, both helping her learn and developing more of my own coaching skills.

Weeknotes #11

The Power of Questions

This week was a shorter week again, back in the office on Wednesday after a long weekend out in Las Vegas. On Wednesday I was introduced to a new member from one of our supplier teams, who is going to help lead on the adoption of Agile ways of working on our account. I really enjoyed our initial discussion, as this particular individual asked a number of open, honest and challenging questions with regards to where we are on our journey, what organisational constraints we faced and how we’d prioritised particular areas so far. It was a great example for me of the impact someone in a coaching or consultancy position can have simply by asking the right questions, as opposed to just blindly accepting what the client asks for. My view on our organisation trying to adopt a framework agnostic way of working where all frameworks have elements that are relevant seemed to resonate well so looking forward to some more fruitful discussion in the coming weeks.

The Coaching Habit

In relation to this, after finishing Escaping The Build Trap I’ve recently picked up a new book called The Coaching Habit.

I made a note of it close to maybe 18 months ago when Don Eitel (I think…sorry if it was someone else!) mentioned it to me in the Modern Agile Slack group. I’m already regretting not starting it sooner, in particular as it’s a book not just relevant to ‘agilists’ but I would say anyone who is in a management role in an organisation.

Training

This week we ran a training session for a group of people within our Assurance Transformation team. It was the first session I myself had run after a six-week period of no training, which is the longest gap I’ve had in the last six months. Along with the time off, I definitely noticed an impact to my delivery, as I didn’t quite feel like I got into the ‘flow’ of how things usually go. Nevertheless the feedback was positive however there is an important learning for myself around keeping fresh and maybe not having quite as long a gap between training sessions next time.

And the anti-pattern award goes to…

In the training, one of the attendees explained around how he and his team(s) use hardening sprints within their delivery. For those of you that aren’t aware, a hardening sprint is essentially a sprint where a team will focus on bug fixing, technical debt, integration testing, performance testing, security testing, etc. —in most cases it being everything that needs to be done before software can actually be released. I was first introduced to it once I joined PwC when someone was explaining how previous successful(!) Agile projects had been run. For me it is my favourite anti-pattern in the sense of it being a clear indication of not remaining true to the principles set out in the manifesto (sustainable pace anyone?).

If you are using hardening sprints, then it’s clear that your definition of done is most likely not very robust, that the work you are completing is not potentially shippable and unfortunately that you have compromised on quality. The irony in articles titled ‘Optimize Your Hardening Sprint for a Quality Advantage’is one that does make me chuckle.

Next Week

Next week I start the week working with a team looking at that million-pound question — “None of our stuff is moving on the board, can you help us fix it?”. I’m hoping to get to the second day of the Pluralsight:Live event on Tuesday in particular with a session on DevSecOps. Then the rest of the week will be focused on some one-to-one coaching conversations.

Weeknotes #08

Leading SAFe

This week, I spent three days on a Leading SAFe course with a number of PwC colleagues. SAFe is the hot scaling Agile framework in the industry right now, used by 70% of the Fortune 100 and like all good practitioners I think it's important to at least make an informed judgement on something based on trying to learn it from those who do it, as opposed to judging from your Twitter feed alone (where I must admit I see a lot of negativity towards it!).

Thankfully, our training was stretched out over three days, compared to the two day format it is usually delivered in. I’m guessing that a two-day version must be slides only, as that’s the only way I could see it being condensed and still covering everything whilst finishing within the timebox. 

I found it difficult at times to engage in the training, mainly as there were a lot of things over the three days that weren’t that new to myself, in particular things like small batch sizes, limiting WIP at every level, slicing work, WSJF, systems thinking, kanban boards at every level, ruthless prioritization etc. 

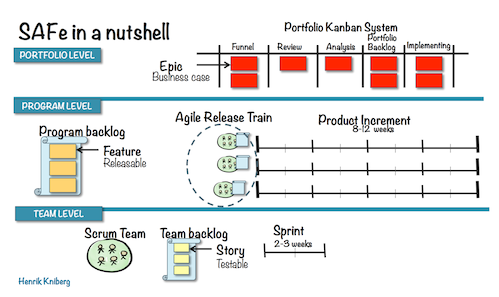
However I definitely feel like my understanding around it has improved, albeit I still prefer the Henrik Kniberg image of SAFe in a nutshell:

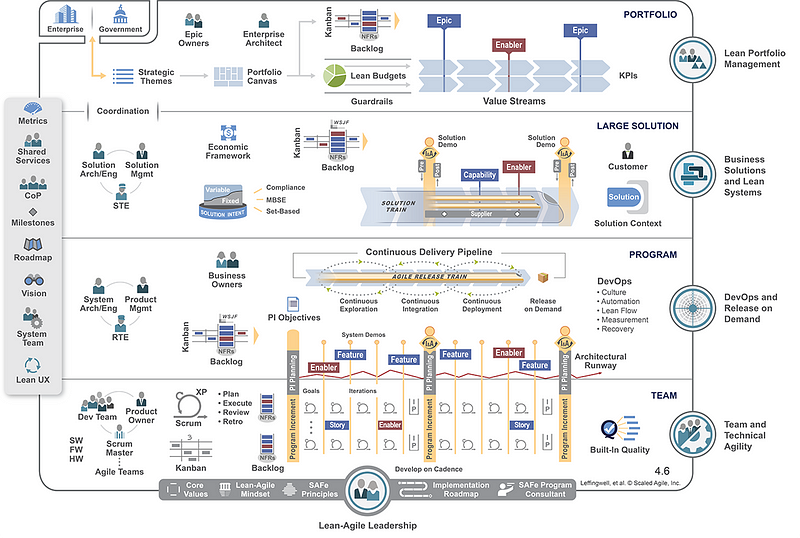
Over the daunting image that greets most:

Whilst I’m not going to get into the specifics of everything I liked/disliked, I don’t think it’s as big an *evil* thing by some practitioners that it is made out to be. I can see why it appeals to a lot of large organisations, mainly those that have over time become dependent on having component teams, as well as having monolithic architectures, reams of technical debt hiding under the hood and/or still wanting to retain some sense of hierarchy and structure. 

Is it a bad thing these organisations are (finally) being introduced to the great work of Deming, Drucker and Reinertsen as well as important topics such as Lean, Value Streams, Kanban, Scrum and Lean Startup? No. 

Are there elements that I wish they would change as they seem to focus more on the right hand side of the manifesto than the left? Yes. 

Do I like the approach to training and it’s renewal costs? Absolutely not. 

Will I be rushing to use it? No, but that’s mainly as I feel in my current context it would be violating the first rule of scaling (don’t scale). However there are definitely elements of it I will think about and look to tweak/use depending on where appropriate (hypothesis writing of epics/features was one in particular I really liked).

Overall I was glad I took the course, mainly as I now feel much more informed as a practitioner. The instructor Patrick handled my tougher questions really well, and it was a pleasure meeting him as well as chatting to various colleagues who I either met for the first time or knew previously over the three days. We have four subsequent coaching days lined up where I believe we will run a full PI Planning event, which was probably the bit I liked the most! Looking forward to bringing that to reality in the coming weeks.

Making Work Visible

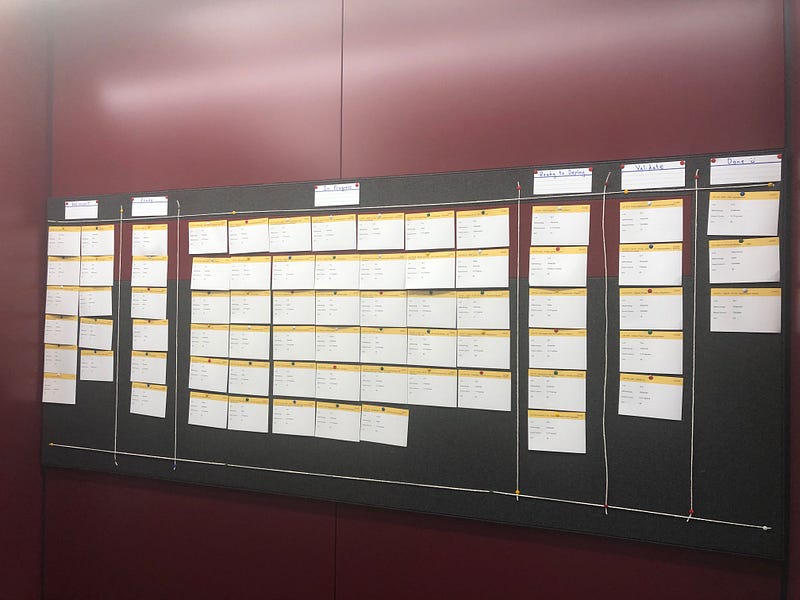
After a heated debate on what is twine vs string, and which is the correct word to use (twine I was told is a northern thing, but search for string on Rymans and the first result is twine so who knows 🙃). We managed to get a portfolio kanban board setup in the office on Thursday.

Thanks to

Sam

for the string/twine suggestion and

Agile Stationary

for the printed backlog!

When making the work visible it’s very clear what the issue is, once again bringing to life a slide I saw Bazil Arden use years ago when he was demonstrating one of the major challenges many organisations are facing:

The hope is that by making the work visible, we can start to have an open conversation about if certain work really is a priority, as well as optimizing the system for flow rather than utilization.

Next week

Next week is obviously a shorter one with the bank holiday on Friday, so I’ll look to put my week notes out a day earlier. 

I’m hoping to take the Leading SAFe exam at some point, as it will be a good way to validate my learning.

Due to commitments outside work I won’t be able to make the first Agile Games Workshop meetup hosted by PwC on Wednesday, feel free to check it out here if you want to know more.

Weeknotes #07

Port’flow’io backlog

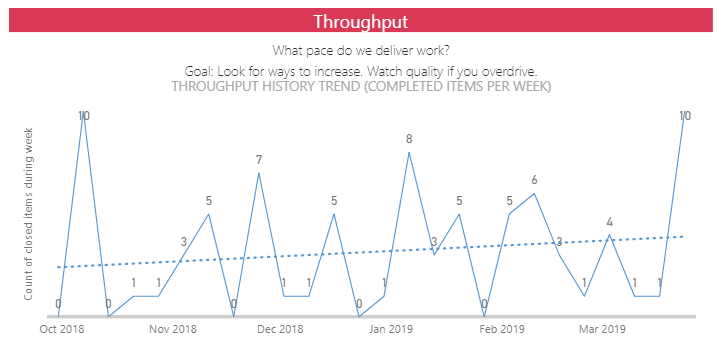
Last week I mentioned about how seeing a lack of throughput lead to a rather heated discussion in our weekly portfolio meeting. I was pleased to see this week that our throughput is getting a lot better, with eight more items flowing through to done in the past week. 

A new item of discussion was raised in the weekly meeting around breaking work down. I highlighted that we needed to be careful that we don’t want to fall into the trap of horizontal slicing at portfolio level, where you end up have a card for analysis, a card for build, a card for testing and a card for deployment, mainly as that masks the actual flow of value to users. 

Whilst this isn’t ‘easy’ I do think a lot of it just requires a bit of unlearning around jumping straight to solutions, and again starting with why. 

In our context I feel that we could/should be utilising more of a design sprint concept from Mark and his innovation team to aid the flow upstream and/or reducing batch sizes of work flowing through our portfolio. 

Our portfolio kanban board has a flow of:

Ideas | Refinement | Ready | In Progress | Validate | Done

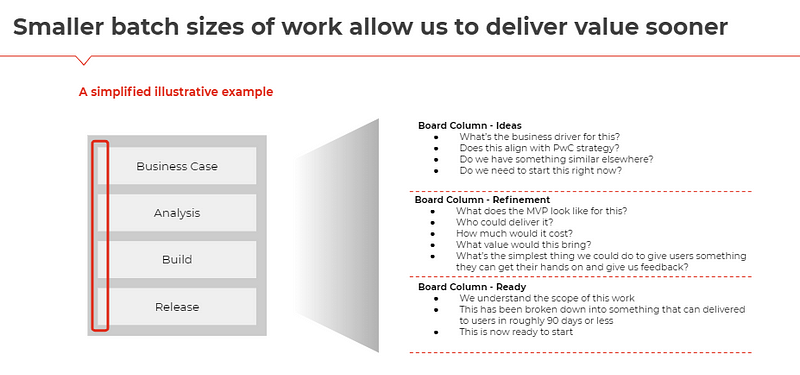
I provided some guidance as to questions to ask upstream:

Interested to know if you think anything else is worth adding.

OK, OK, OKRs

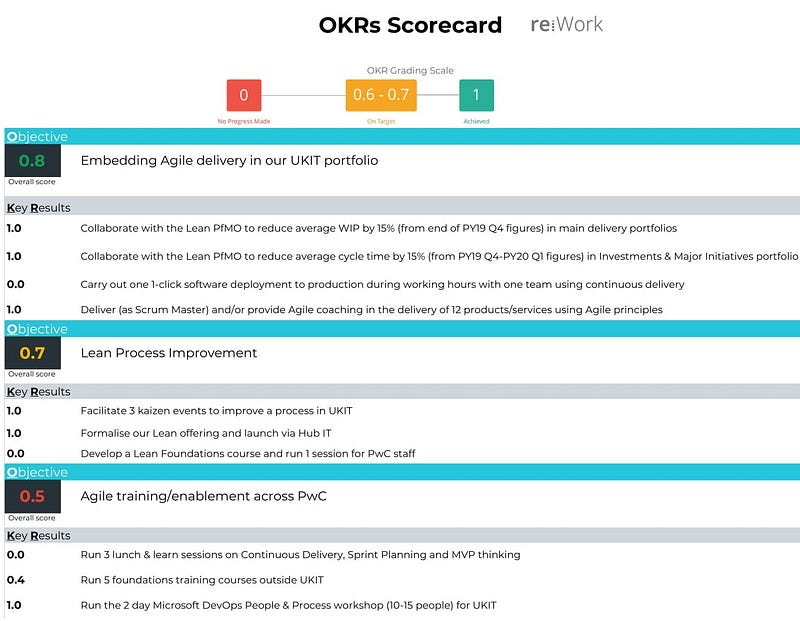
This week we got together as a team to review our OKRs, grading ourselves against how we had performed. We’ve been using OKRs for the past 9 months, and finally it feels like we’re getting the hang of them. 

The first ones we put together didn’t come close to the target 0.6–0.7 grade range, which alluded to them being too ambitious. The second ones we put together ended up being too “easy”, as four out of the five achieved a score of 1.0 — so looks like we set the bar too low!

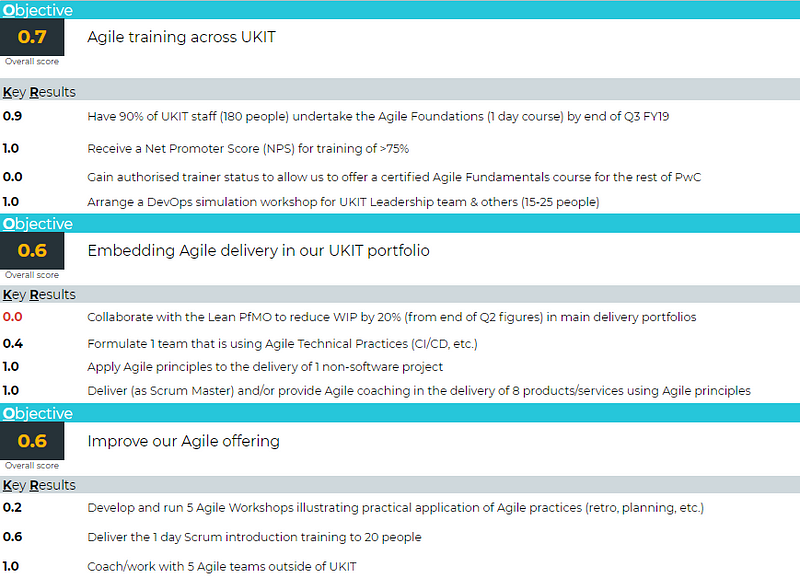
Finally, with our latest grading, it looks like we’ve achieved the right amount of balance of ambition/reality in our objectives:

As a team, we’re going to carry on using them as we think they are really useful as an alignment tool. We’ve agreed to regularly check them at the end of each 4-week sprint just to make sure we aren’t losing site of things. Our leadership team have expressed an interest in applying the same concepts which could hopefully bring some portfolio and team alignment to the work it is we are undertaking. A side project may be some AzDO (yes I am going with that abbreviation) customisation to trace PBIs -> OKRs — similar to what Microsoft talk about here.

Escaping The Build Trap

At the beginning of the week our TV at home was broken, which gave me a much needed push to pick up a new book to read. 

I’ve started reading Escaping the Build Trap by Melissa Perri, which is already edging into the ‘must reads for practitioners’ category of my Agile library. 

Such is the quality of the content/learning that I’ve found myself taking screenshots (reading on iPad, ebooks FTW) of most pages, as highlighting a whole section seems to defeat the purpose of what highlighting is for! Hopefully I’ll finish it over the next week and can give it a full review, in particular if it’s pushed its way into my all time favourites.

Next week

Next week I’ll be taking the Scaled Agile Framework – Leading SAFe course with a number of other PwC colleagues. I’m looking forward to the learning outcomes, in particular being able to make a more balanced assessment of SAFe. 

I hear both good and bad (more the latter) things about it, so it should be interesting. I view all methods/frameworks as tools in the toolbox, which should be used when relevant to context, so will be good to add this to the list and I’m sure it will be a fun few days of learning. 

A number of our leadership team/senior managers will also be attending a G2G3 DevOps simulation. I hear nothing but great things so hopefully it sparks a lot of discussion and challenge!

Weeknotes #06

Measure what matters

This week I’ve had a number of coaching conversations around metrics and measurement. On Tuesday we had our weekly portfolio review meeting which always proves to be one I find challenging. With an inordinate amount of WIP in our IT portfolio it’s proving very difficult to help people ‘get it’ and focus on finishing over starting, as well as slicing demand down to small batch sizes of work, regardless of methodology used. This boiled over as I found myself disagreeing/arguing with an attendee of the meeting who viewed slicing work down as admin, that customers have no problems with our delivery and that the data was “wrong”.

I wasn’t particularly proud of the fact I’d resorted to calling someone out publicly, but it did make me question what matters to people measurement wise, and challenge my own thinking. As you can probably tell I’m obsessed with small batch sizes of work and swarming on aged WIP, using empiricism to support the actions you take, mainly because for me you are viewing this with a customer lens. However it’s clear based on what happened this week that these metrics aren’t quite what matter to others. A positive was the conversation I had the following day which centered on setting limits within the overall WIP (say for a particular type of work), which showed that some were embracing the idea. 

Checking today I can see that Throughput for this week has gotten to the joint highest it has been in the past six months, so looks like the message on Tuesday did land.

Slowly, slowly catchy monkey

Shameless plug

This week, the video of myself and my role within PwC was published to our careers website. Whilst I always find being filmed a bit awkward I did enjoy having the opportunity to share my experience, in particular as I feel people can have a certain view on the ‘big four’ life. It’s definitely not what I had imagined it would be like and I can safely say the last year (I’ve been here three and a half years) has been the most enjoyable I’ve had in any organisation so far. Watch the video below if you want to see someone over emphasise hand movements!

[embed]https://www.youtube.com/watch?v=5-wg9CyLZr8[/embed]

Sprint Reviews

This week I attended a couple of sprint reviews, both of which were not particularly great to actually dial into. One was flat with little/nothing demonstrated (showing your Azure DevOps kanban board does not count), and no energy in the room. The other had an enthusiastic group ready to have good discussion but a main stakeholder who accepted didn’t turn up, which lead to the team just moving on to the retrospective.

Once you start taking Agile outside of software then the sprint reviews are hard, but not impossible. I’ve found that to make them engaging you should have meaningful discussion points and/or at least something to show. 

If you are falling into the trap I mentioned at the beginning, be sure to take a read of Your Sprint Reviews suck, and that’s why!

Next week

Next week is a quieter week, with no training planned. We’re getting an increasing amount of project teams who, whilst not delivering in an Agile manner are at least wanting to adopt a kanban board for visualization/management of work. This for me is a good start for people on their Agile journey, and I’ve got 4/5 teams lined up next week to speak to and get them started on that journey…

Weeknotes #05

DXB

This week I’ve been out in Dubai in the PwC Middle East office, running three 1-day Agile Foundations sessions for people in IT, Digital and Finance. 

For these sessions I made some tweaks to the usual format our team uses, mainly in replacing Featureban with our version of Lego4Scrum. Reason being that I wanted to have an environment where attendees of the training get the chance to bring all their learnings (agile principles, scrum roles, kanban, MVP) together. Plus I find the lego exercise in a lot easier to facilitate than Featureban, as there is more freedom for creativity, whereas with Featureban some teams do need a lot more help in order for the exercise to be effective.

“what did one brick say to the other? Never Lego”

The training was requested by members of a new leadership team being formed out in Dubai, who have decided to really focus on their own people as a starting point, with Agile one of the first things to introduce to the group. I really appreciated that a number of the leadership team made the effort to attend, as quite often leaders want to “go agile” but then won’t attend sessions like this, immediately leading to attendees questioning the validity/seriousness of the message. 

Thankfully this didn’t happen here, which made the training had even more impact, I’m very thankful to Sophie Thomas and the rest of the team for “being the change they want to see” and inviting me out there this week.

Feedback over the 3 sessions was extremely positive, which is always nice. 

My favourite being this:

😊 😊 😊

After the second day I was getting quite tired, but reading this at the end of the day definitely did spur me on to make the third session just as enjoyable and energetic. It reminded me of when I was out in Brazil before Christmas and ran seven ½ day sessions over five days, in particular how I really struggled motivation wise both towards the final sessions and in subsequent weeks when back in the UK. 

Recently I’ve reflected on the fact that when you’re running training, remember that people are giving up their time to listen and learn from you. So, whilst it may feel onerous, repetitive, and potentially boring, remember that by attending people are saying they believe in you and what you’re saying, as well as showing a big appreciation for what it is you do. 

As a trainer you shouldn’t view that as a chore but a privilege that many people don’t have, so make sure that is reflected in your delivery and mindset.

We’ve already been talking about adoption and next steps for the Middle East, with the potential for another set of sessions in the coming months. 

One of the attendees in particular seemed really impressed with the concepts/demos I showcased around portfolio kanban, which I feel would be a good first step for the team out there, especially as thief too much WIP and thief conflicting priorities seem to be prevalent in discussion during the training.

If you know you know…but if you don’t then read

Making Work Visible

LLKD19

Unfortunately being out in Dubai meant missing out on my favourite conferences — London Lean Kanban Days. Despite not being able to attend I was following the hashtag on Twitter through breaks in the training with a bit of FOMO. Sessions that caught my attention included:

Pawel Brodzinski — Power as privilege

Mainly due to his LLKD17 session on Emotional Safety, which I found to be so honest and genuine, I always find Pawels talks engaging, emotive and a must see.

Olga Heismann — Forecasting in complex systems

I actually had the pleasure of seeing this at LKCE18, with Olga’s talk in the same room before my own session. I was blown away by the incredible detail and knowledge within the talk, looking forward to watching again.

Dan Vacanti — Don’t be a ditka

This session has caused a bit of stir over the Agile twitter-sphere, mainly due to this slide:

Source — 

Twitter

As someone who takes a lot of inspiration from Dan, I always find his books and talks interesting, engaging and full of learning. So looking forward to when this one is available. I also need to have an in depth read of his supporting piece here (one for the flight back).

Looking forward to those as my “top 3” when available, and congratulations to Jose Casal and the rest of the BCS team for what looks like another successful conference.

Next week

Next week I’m back in the UK (as this goes out I will hopefully be in the air on the way back to London) and looking forward to a number of coaching conversations. For our team next week is a big one, as James takes the lead on running a kaizen event for our cloud provisioning process.

With our UK CIO Stuart Fulton attending it’s again a strong statement to the rest of the organisation around how serious we are about enabling business agility. Looking forward to the outcomes of what should be another good week for learning in our Agile journey.

Weeknotes #04

Pull-based coaching

As mentioned in previous weeks, our approach to Agile adoption has been very much centred on a pull based approach. Whilst we do what we can in marketing and training, we aren’t going to “force” people to go Agile, nor are we of the mindset you have to ‘agile everything’.

The other day I had an interesting observation whilst in my social time. Normally I play badminton a couple days a week with local meetup groups and, after one particular game, I noticed something that for me is a great analogy for Agile coaching. The doubles pair we just played against clearly had one stronger player of the pair. Once the game was over and hands were shaken, the stronger player of the pair prompted to coach/tell their partner what they should do to improve. What was interesting for me was that the person receiving the feedback had not requested the coaching/advice, nor did they appear to really want the help. For me this was a great reflection on the reality of an Agile coach working with teams and/or individuals. 

If you are acting as a Coach but simply imposing Agile onto people without being asked, this is the exact effect you are likely to have on someone. 

They may not desire or require your assistance, and subsequently it makes for an even more uncomfortable situation by them then feeling like they have to listen to you. Hence, try your very best to adopt pull-based coaching.

Portfolio Baby Steps

Our main focus in adopting Agile ways of working has been concentrating our efforts at portfolio, rather than team level. The main inspiration from this of course being the flight level captain himself Klaus Leopold. Using Klaus’ flight level model you could argue we’re focusing somewhere between flight level two or three (IT Portfolio level), but the main point is that we’re focusing on tackling Agile principles at a higher level first, in conjunction with a few (but not all) teams.

One thing we’ve done as part of this is map our portfolio of work on a kanban board, with all the steps a piece of work goes through, as well as some rough, ROI score (fibonacci-esque business value ÷ effort) for prioritisation and what methodology is being used to deliver the piece of work. 

Since introducing WIP limits, we’ve managed to reduce portfolio WIP by 28% in the last 6 months, however we’re still struggling on refinement and slicing work down to smaller batch sizes. In particular average portfolio cycle time still remains very high due to older items only just moving to done, but at least it’s trending in the right direction.

This obviously makes something like WIP limits a hard sell to those sceptical as the time to deliver isn’t noticeably reducing as much as we’d like, so something to monitor in the coming weeks and learn from.

A positive for me this week though has been seeing the portfolio team apply their learning from Featureban in our Agile training when it comes to pipeline replenishment. Prioritising only a few items for what work comes next, and staying strict to the WIP limits. Hearing “we only have room for 2 so what’s the highest value” on a call was something we haven’t heard before, so that’s a positive. Slowly getting there with baby steps…

Manny on the Map

Yesterday myself and Marie ran another of our Agile Foundations sessions, this time in our Manchester office. Despite the session being centred on IT we did have some participants from our client teams as well, which I take as a positive to the positive feedback the course has received.

One common point of discussion is around budgeting in an Agile context and, whilst we discuss how generally the concept of annual budgeting needs to change, we include an example of how to set a price for Agile projects. 

I also have an internal article about using Troy Magennis’ free tools and in particular the throughput forecaster. Whilst this is outside the scope of a #weeknotes, let me know if you’d like to see in a separate post this as a worked example.

Overall it was another really fun session, with some great characters in the room, in particular showcased via the the feedback we received.

Class comedian — we know who you are :)

It brings us to the 80% mark of people we’ve trained, with two sessions left for IT. After that is when the hard work really starts but, I must say, it is the bit I’m most looking forward to.

Next week

Next week I’m heading out to our Middle East office, running a series of Agile Foundations courses out there and returning back to the UK on Friday. 

I’ll be missing out on my favourite conference — London Lean Kanban Days but I am intrigued to see how the training lands with folks out there, in particularly given some of the concepts on celebrating failure, psychological safety and embracing uncertainty…a great chance to develop my coaching experience!

Weeknotes #03

Partner Up

Last week I talked about a new initiative we’re trialling called Partner Up. Partner Up is opportunity for PwC staff below Manager grade to showcase technologies and interact with Senior Staff. Held in one to one (or one to many) sessions, volunteers are encouraged to discuss modern technologies with those who have the ability to create future opportunities for PwC.

For my Partner Up session, I had the pleasure of pairing up with Diana, who works in our IT Consultancy team. Diana had decided to showcase the capabilities of Google Sites, in particular things that could be done using Google Apps Script. 

After 45 minutes of learning a hell of a lot, including calendar integration with forms, qualtrics surveys and data visualization embedding within sites, Diana was closing the session in showing me the capability of integrating other tools we use. The highlight being the capability to embed a kanban board within a Google Site, which to me was fantastic!

Agile nerd alert 😍 😍 😍

I started to imagine a world of submitting a request via a Google Form, which then copies into a live Kanban board, where you can see the lead time for your request, where it sits in the queue etc etc…evoking memories of the Phoenix Project and visualising lead times for replacement laptops…always a dream of mine to implement something similar!

Special thank you to Diana, she really went above and beyond what I expected and it was great to have an hour dedicated to someone helping me learn.

Feedback, feedback and feedback

With our performance year coming to an end this month, the inevitable overflow of feedback requests have been hitting my inbox this week. 

One of my struggles with this time of year is determining what warrants feedback and potentially turning down requests where not appropriate. 

As a firm we have our professional framework which, whilst important, feels unfair/unfit for purpose when, for example being asked to score someone against “global acumen” if the work they did was help me out on something small locally. Similarly, I often find people request feedback as a means to showcase they’ve completed work, rather than using it for a constructive conversation centred on development. If that’s the reason for a feedback request then surely we’ve lost the spirit of it?

So yes, I really struggle with this time of year, also as I find it increasingly challenging with what we do to quantify the impact myself and our team is having on the organisation. 

How do you quantify internal coaching impact? Number of people trained? Training NPS? Number of Agile projects vs. Waterfall? Number of teams coached? New products launched using Agile principles? Portfolio WIP trend? Portfolio/team cycle time? Individual feedback?

I’m still learning about what we can look at empirically in supporting what we do, but for now have settled on a blend of all the above in terms of my own performance appraisal. 

Before you ask, yes, we are still doing annual performance reviews. 

Mid-year reviews take place as a checkpoint and more of an informal discussion, but end of year is when you get your performance rating which may/may not be attributed to a pay increase and/or bonus. 

The majority of people I talk to express surprise/dismay we still do it this way.

I’ll put that down as one for the cultural debt backlog to be addressed long term…

Training

Today I’ve been running another Hands On With Azure DevOps session, this time for folk in our Consulting team. The session has gone well, with pretty much all attendees feeding back that they had learnt a thing or two, which is the main thing for me. One particular feedback was that it was “the best training someone has been to in the past year” — I didn’t stop to ask if this was the only training they had been on ;)

The course is structured like so:

I learnt that I didn’t have the right setup for enterprise licenses today, which meant a number of people couldn’t move work items on the board — not ideal! However I found a workaround through pairing and learnt about what I need to fix for next time…so a good day for me on the learning front as well.

For those of you who are users, I’d love to hear if you have any feedback on the above and if you think there are significant gaps for first time users.

Next week

Next week I’ll be finishing my performance appraisal, putting my Google Sites learning into practice, and heading up t’north to our Manchester office for an Agile Foundations session. Looking forward to a week of reflection, learning and starting others on their Agile journey.

Weeknotes #02

Wroclaw (Vrohts-wahf)

As I mentioned in closing last week, I headed out to Wroclaw (pronounced Vrohts-wahf) to visit one of our suppliers this week.

Accompanied by Jon, Andy and Stuart we had 3 days of good discussion on Agile, DevOps, Product Management, UX, Data Science, Security and, what is fast becoming my favourite topic, anti-patterns. 

Whilst there was some really impressive stuff that we saw, mainly from a technical practices perspective, there were a number of anti-patterns identified in our *current* Agile ways of working, largely being imposed from within our own organisation. Sprint zero, gantt charts, change advisory boards (CABs) approving all deployments (even to low level environments), RAG status, the iron triangle as the measure of project success, changes in scope needing a change request to be raised — all got a mention. 

It’s clear that we still have a large amount of cultural debt to overcome. 

For anyone new to the concept of cultural debt, Chris Matts describes it well in that it commonly comes in two forms:

As a team we are very strict in our interactions with individuals that training and/or coaching must be via pull rather than push (i.e. opt-in). 

However the second point is, I feel, much tougher. Plenty of teams are wanting to plough on ahead and get a kanban board setup, do daily stand-ups and retrospectives, etc. and, whilst this enthusiasm is great, the mindset and reason why we’re choosing to work in this way is often lost.

An outcome of our discussion was creating a supplier working group to work with our team, so we can share some of the approaches we’re taking to encouraging Agile ways of working, and how we can collaborate and support, sharing data/examples to drive continuous improvement rather than taking on the organisational challenges individually.

Less is more?

We also had the last couple days of our Sprint this week as a team. 

We like to work in 4-week sprints, as we find this is the right balance in cadence and as a feedback loop with stakeholders. From the end of Jan we went down to one less team member, so with five in our team I was interested see how our throughput was compared to previous sprints.

Our team throughput per sprint over the last 6 sprints

As you can see, this sprint we managed to complete more work items than in any sprint prior.

Upon review as a team, the general consensus was that we put this down to having run more training in this sprint compared to previous sprints (a training session is 1 PBI on our backlog) and that as we trained more people it spawned off more opportunities from a coaching standpoint. We’re going to stick with current team size going forward, mainly due to a good dynamic as a team and having a good variety of skillset.

Done column = 😍😍😍 (shoutout

Agile Stationary

for the stickies)

One thing we did try this sprint as an ‘experiment’ over this sprint was working with both physical and digital boards. It’s rare for us as a team to have a day where everyone is in the same office, so primary for us is a digital board. However we wanted people to also have the view of a physical board in our London office, mainly so they could see what we were working on and how a kanban board works in practice. Whilst we’ve not had loads of questions, general feedback seems to be positive and people like seeing it in action — we’re hoping it encourages others to experiment with physical and/or digital versions of their workflow.

TIL Python

One learning I have made this week is I’ve picked up a little bit of Python knowledge. One of my biggest frustrations with FlowViz has been how the Scatter Chart within Power BI cannot handle date values and can only use whole numbers in the X-axis, therefore needing a date string (i.e. 20190301) which of course, is then treated as a number rather than a date (so 20,190,301) leading to a rather bizarre looking scatter plot.

And the award for most useless Scatter Chart goes to…

However this week Microsoft announced that python visuals are now available in the web service and hence, I could ‘code’ my own python chart to display the scatter chart how I really wanted it to be.

After some browsing of the web (read: Stack Overflow) I managed to get a scatter chart working with my dataset. However I needed the brilliance of Tim in our Data Science team to help get the dates working how they should be (checkout his Tableau public profile btw), as well as clean up the axis and add my percentile line. It’s not *done done* yet as it needs a label for the percentile line but I’m pretty pleased with how it is now looking.

Much better (thanks Tim!)

Next Week

Next week I’m running what I hope will be the polished version of our Hands on with Azure DevOps course for a group of 20 in Consulting. 

I’ll also be learning about Google Analytics, as we launch our Partner Up initiative where senior staff pair up with someone junior who then demos and coaches the more senior person about a new tool/technology, all in the spirit of creating a learning organisation — looking forward to sharing my own learnings with you all next week.