Azure Devops

Adding a Service Level Expectation to your Azure DevOps board using Power Automate

The final part in this series of three blogs covering how you can add flow metrics directly into your kanban board in Azure DevOps. This part covers how to add in your Service Level Expectation (SLE). Check out part one if you want to add Work Item Age or part two for adding Cycle Time

What is a Service Level Expectation (SLE)?

As per the Kanban Guide:

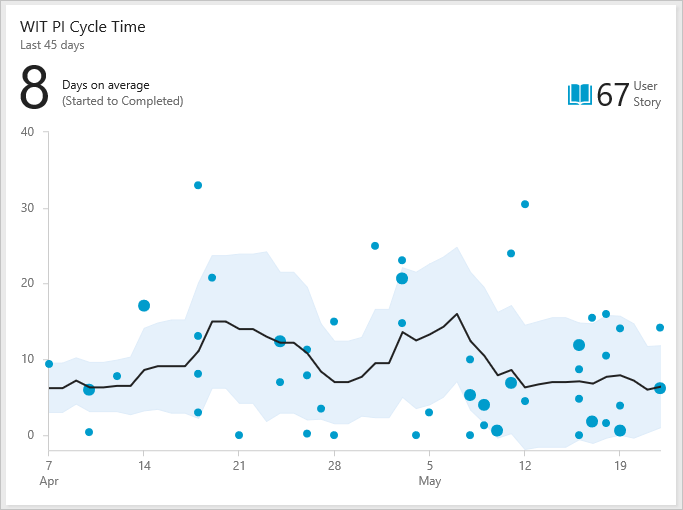
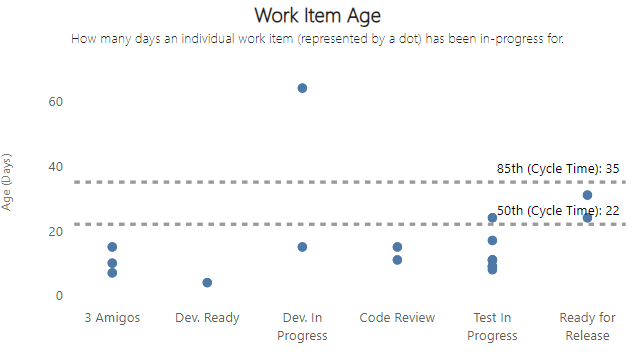
The SLE is a forecast of how long it should take a single work item to flow from started to finished. The SLE itself has two parts: a period of elapsed time and a probability associated with that period (e.g., “85% of work items will be finished in eight days or less”). The SLE should be based on historical cycle time, and once calculated, should be visualized on the Kanban board. If historical cycle time data does not exist, a best guess will do until there is enough historical data for a proper SLE calculation.

I’ve highlighted the part that is most relevant for this blog, which is about making this visible on the kanban board. Again, like the previous posts, some assumptions are made as part of this:

  • Within Azure DevOps (ADO) you have an inherited process template and access to edit this

  • You know how to generate a PAT in ADO and have already done so with full or analytics read access

  • States and state categories in your process template are configured correctly

  • You have access to Power Automate (Microsoft’s automation tool)

  • We are using data (not a best guess) to calculate our SLE and that we have enough data for it

  • We are calculating the SLE for all items on the kanban board (i.e. not breaking this down by work item type)

  • We are going to use the 85th percentile cycle time for all items flowing through our board as our SLE

Deciding where our SLE will go

The kanban guide is not explicit about where the SLE should go, simply that it should be visualized on the board. Given we are working with ADO, it limits our options in where we can make this visible. For the purpose of this blog, we will focus on how we can add it to the work item form, although the wrap up at the end of this blog will show another way that it can be done…

Adding custom fields for Cycle Time percentiles

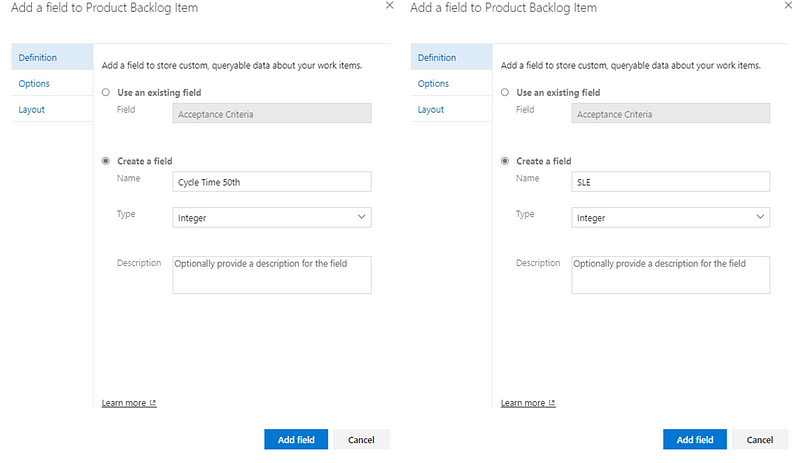
Consistent with the previous blogs on Work Item Age and Cycle Time, we will add a couple of custom fields to our work item form. Keeping with the same theme of focusing on a single work item type, we are again going to use Product Backlog Item as our chosen type.

We are going to add two custom fields to the form. ‘Cycle Time 50th’ will be for the 50th percentile of Cycle Time and ‘SLE’ will be the field for the 85th percentile cycle time (our chosen percentile for our SLE). Again make sure both of these are configured as integer type fields:

Now, an optional step here is to hide these fields on the work item form. We can still populate these fields (and make them visible on the board and/or query them) but it just means less ‘distraction’ from an end user perspective:

Now those are done, we can move onto the automation!

Adding the SLE to the work item

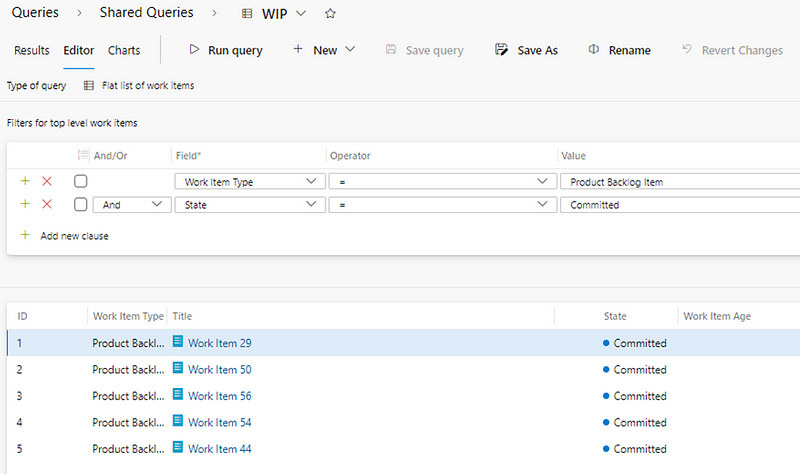
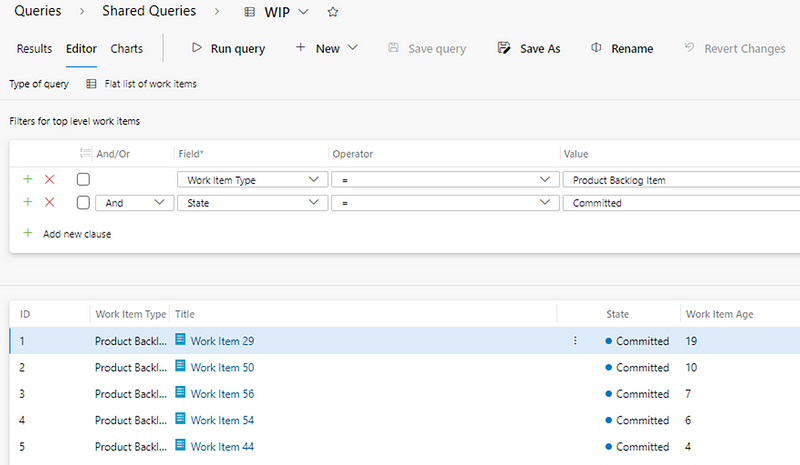
We will start by making a slight tweak to our query we created when configuring our Work Item Age automation. If you go back to that query, you want to add in to your column options ‘Cycle Time 50th’ and ‘SLE’:

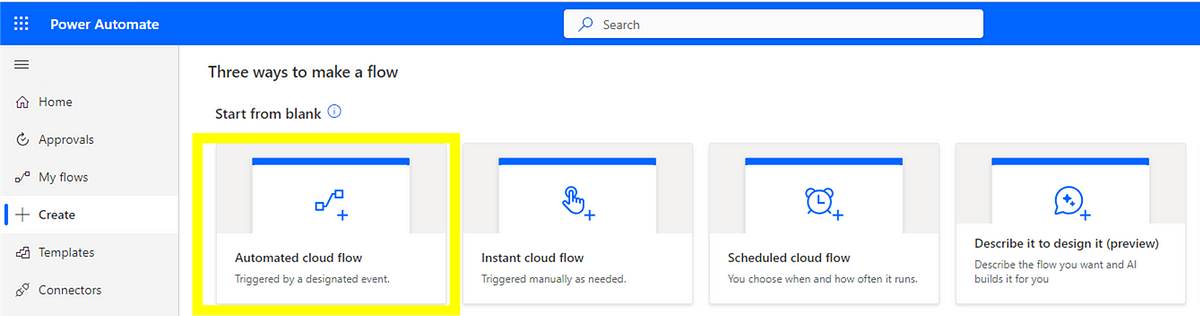
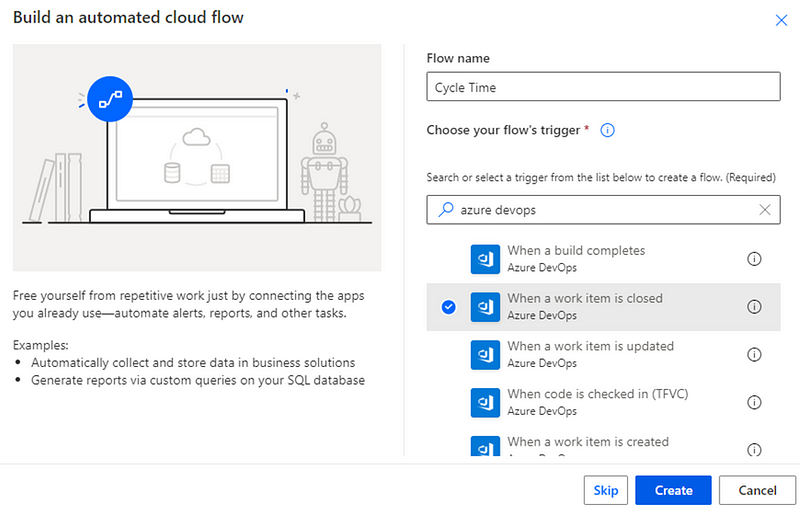
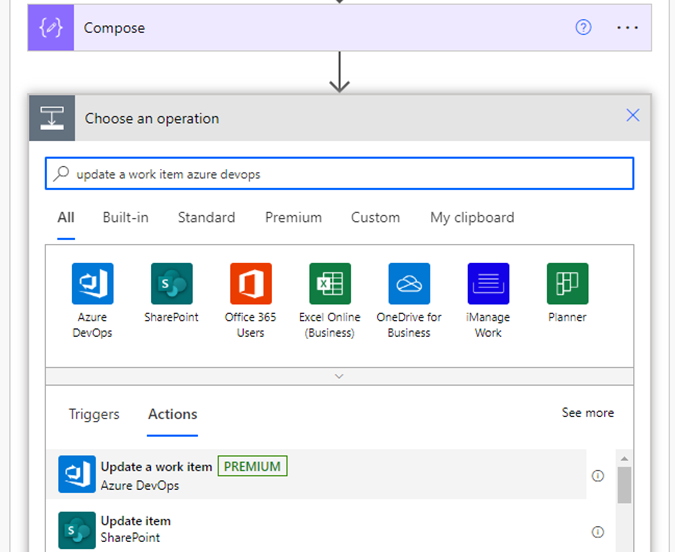
After this we are going to go to Power Automate. There are two options here for the type of automation we choose and how up to date you want your SLE to be. One way is to take the same approach we did for our Cycle Time automation and setup an automated cloud flow which would then have the SLE update as and when an item moves to ‘Closed’.

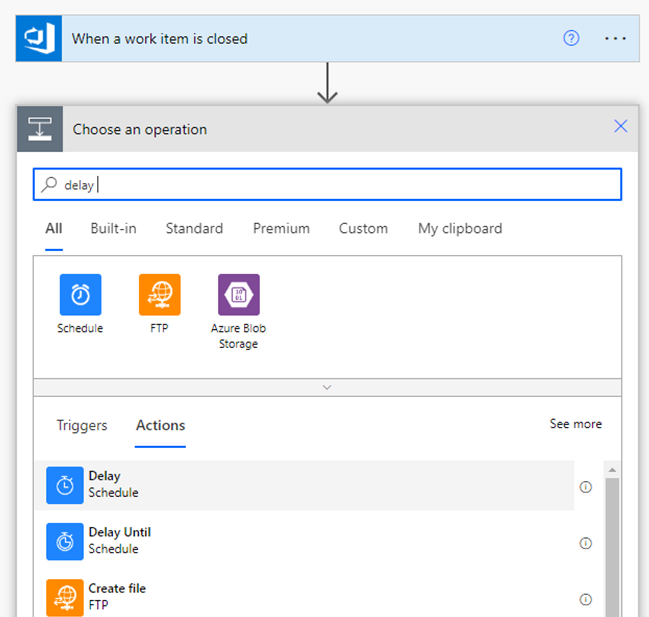
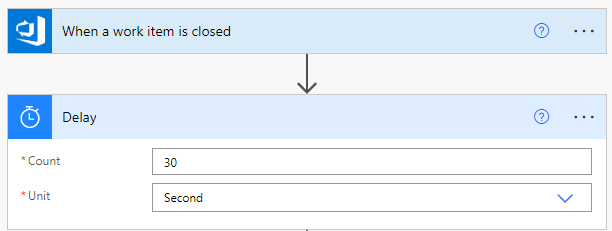
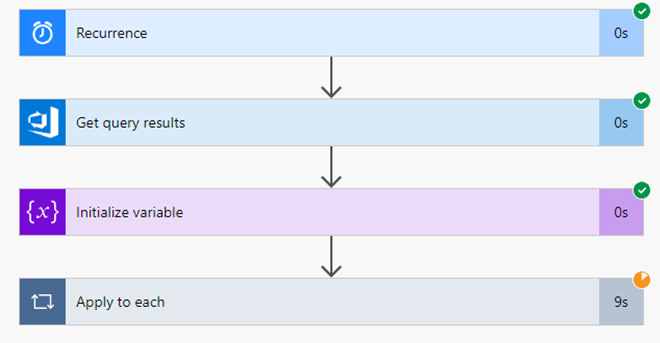
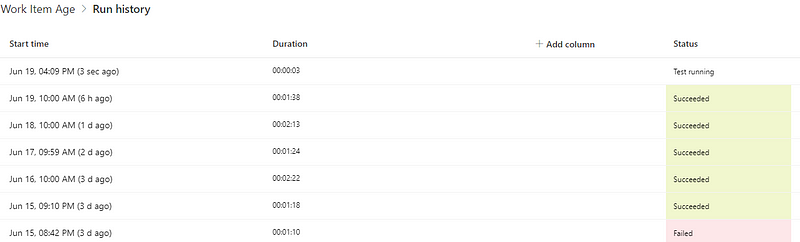
The other way (and the way this blog will cover how to do) is to use a scheduled cloud flow like we did for our Work Item Age automation:

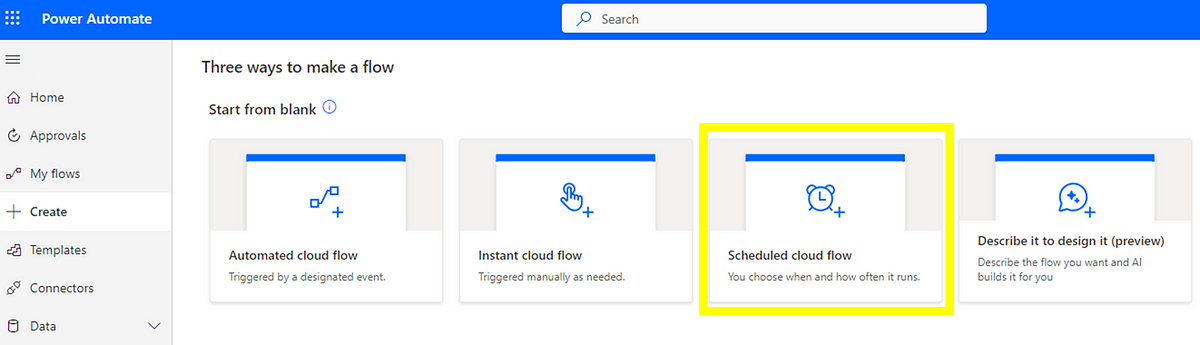
However, what we are going to do is set this up to run more than once a day. Mainly because multiple items will (hopefully!) be moving to done during the day and we want our SLE to be as close to real-time as possible. I’ve gone with the following schedule of running every four hours:

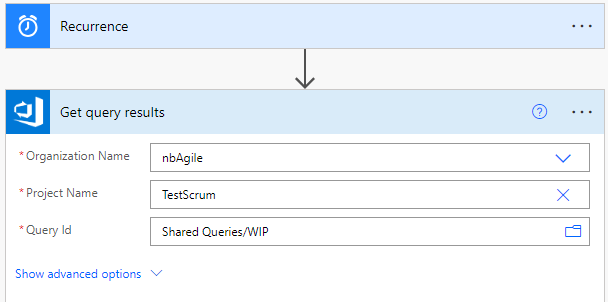
Our next step is the same as our Work Item Age one, where we will get our query results:

Again, ensure that you input the relevant Organization Name and Project Name where you have created the query:

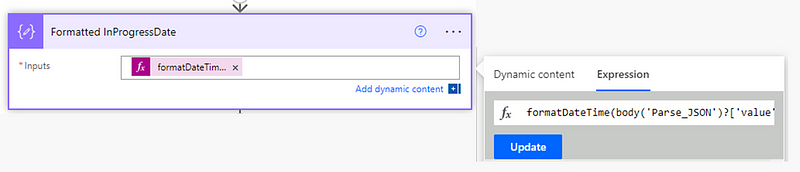
Following this we will add a step to Initialize variable (called ‘DateRange’). This is where we are going to dynamically look at the last 12 weeks’ worth of cycle time to calculate our percentiles. The reason why we use 12 weeks is so that we have a good amount of samples in our dataset — feel free to use less or more if you prefer. Our variable is going to be called DateRange of type String, with the following expression:

formatDateTime(subtractFromTime(utcNow(), 12, 'Week'), 'yyyy-MM-ddTHH:mm:ssZ')

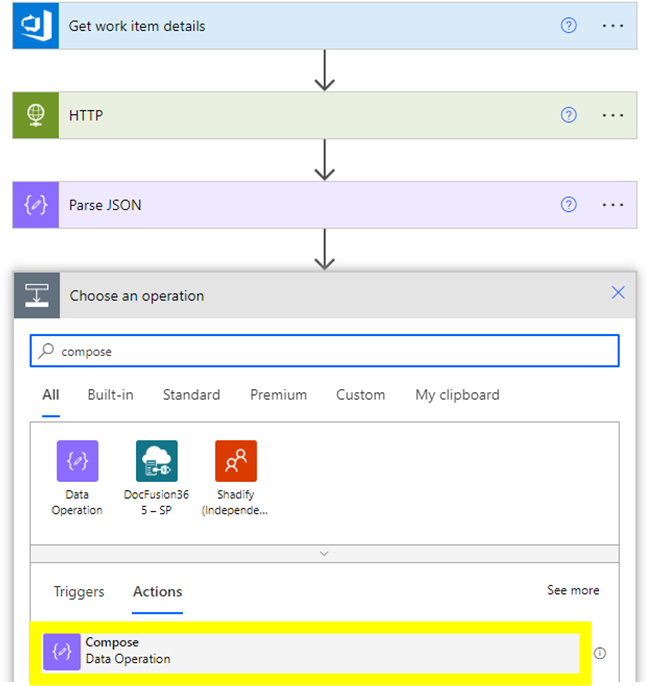
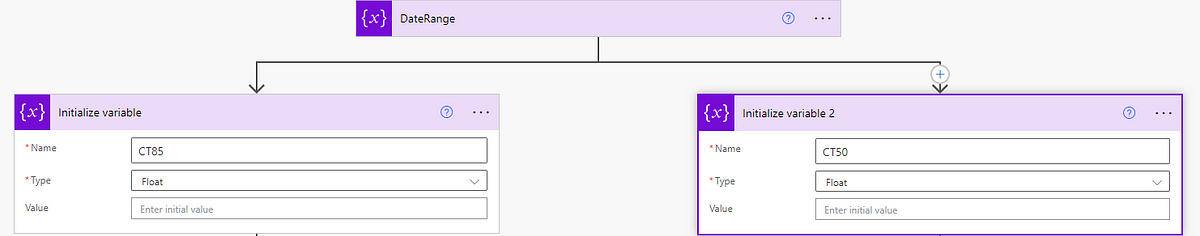
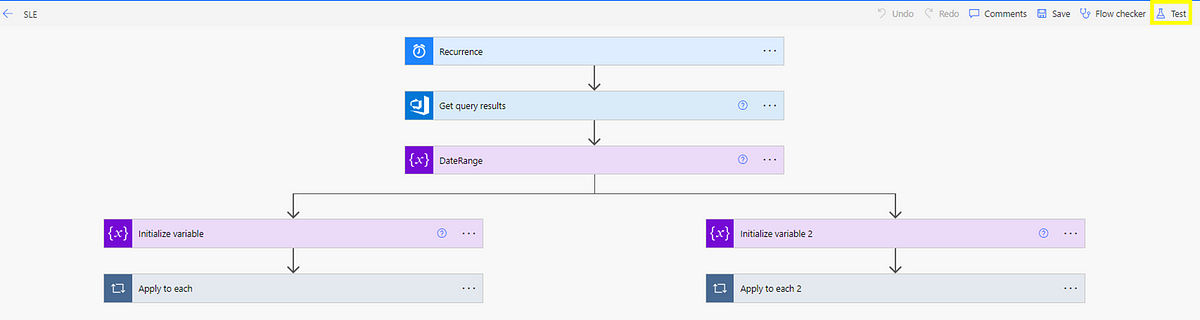
The next part is where we are going to do something different than previous. Rather than add a step, we are going to ‘Add a parallel branch’:

The reason why is because we are populating both our 50th percentile AND our SLE (85th percentile) on the work item form, therefore we want them to run in parallel.

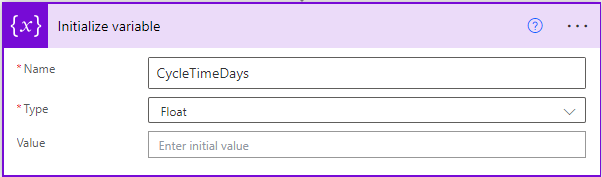
Under each branch, you are going to add a step to initialize a variable. One should be called CT85 (for the 85th percentile), the other CT50 (for the 50th percentile). Both should be of type ‘Float’:

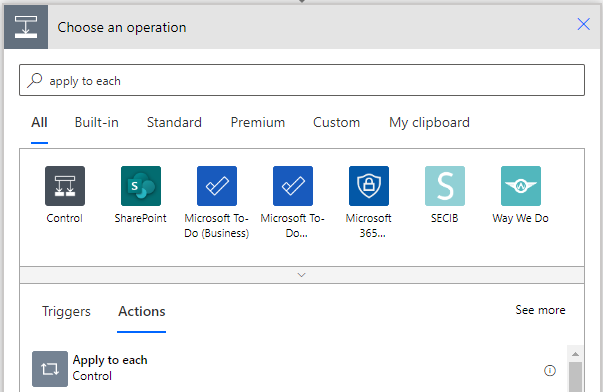
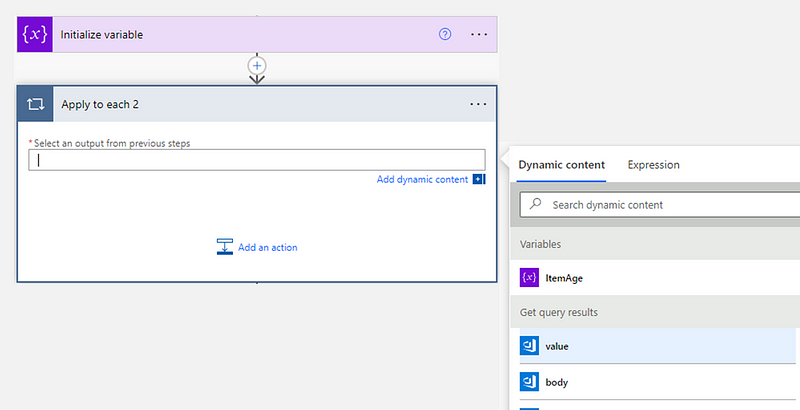
Next we are going to add an Apply to each step under each branch, populating it with the value from our ‘Get query results’ step:

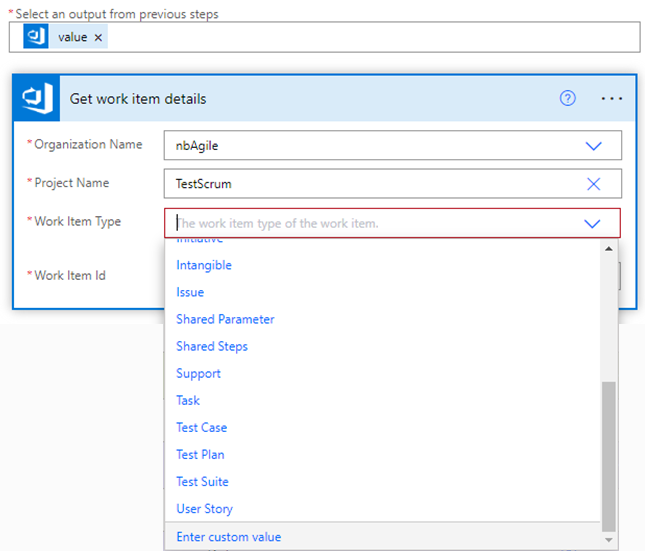
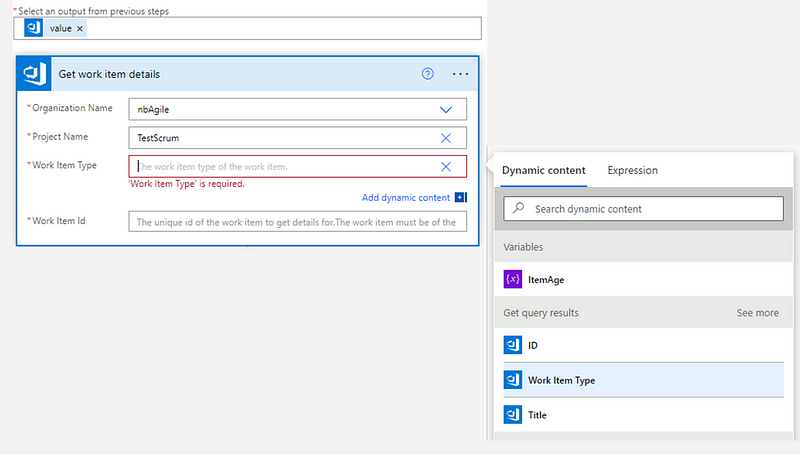
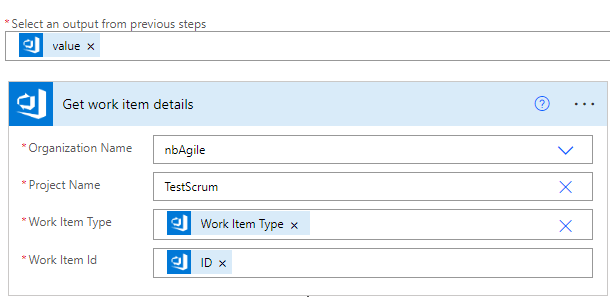
After this we are going to add a step under each branch to Get work item details. Here we want to make sure our Organization Name and Project Name match what we entered at the beginning and we are going to populate our ‘Work Item Type’ and ‘Work Item Id’ fields as dynamic content from our Get query results step:

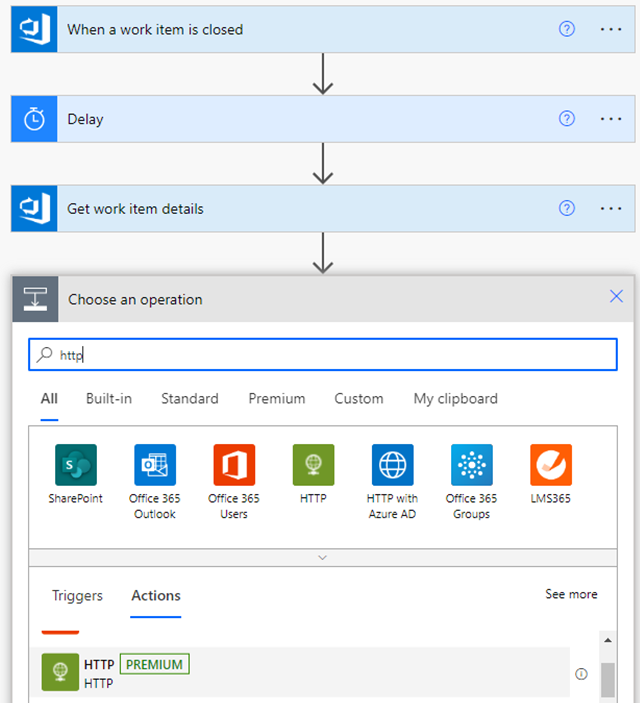
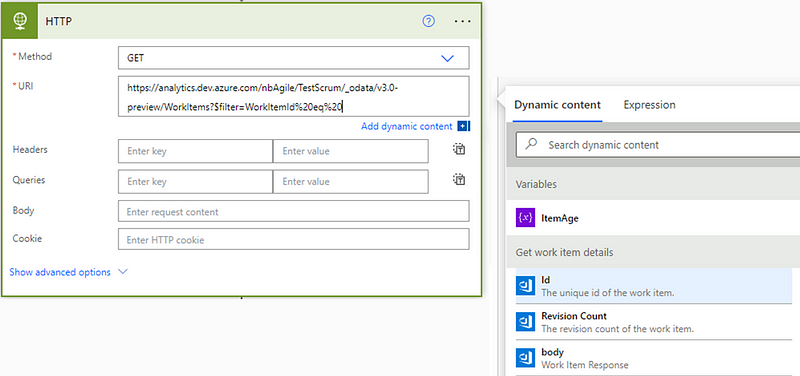
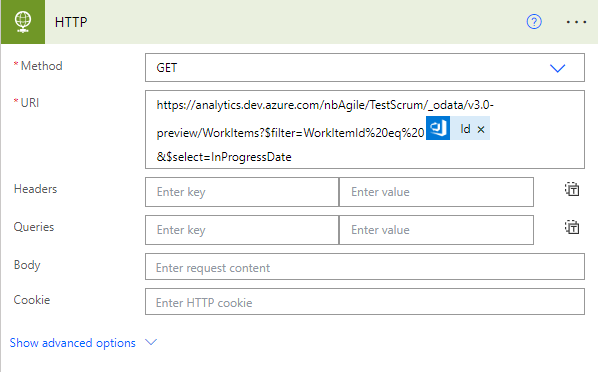
Next we are going to add a HTTP step under each branch. This is where we are going to get our cycle time percentile data. Same as before the method should be ‘GET’ and our URL should consist of the first part (same for both):

https://analytics.dev.azure.com/ORG/PROJECT/_odata/V3.0-preview/WorkItemBoardSnapshot?%20$apply=filter(%20Team/TeamName%20eq%20%27TEAM%20NAME%27%20and%20BoardCategoryReferenceName%20eq%20%27Microsoft.RequirementCategory%27%20and%20DateValue%20ge%20

Please note —it is essential here that the ORG | PROJECT | TEAM NAME values match your own ADO project, otherwise it will fail.

Next it’s the dynamic content of the DateRange variable:

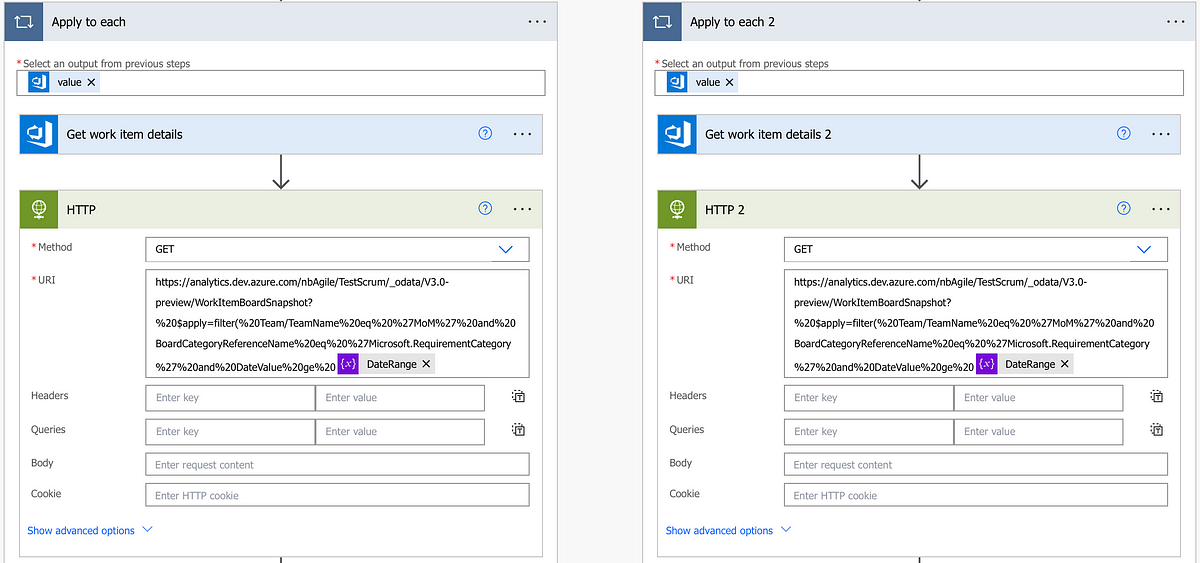
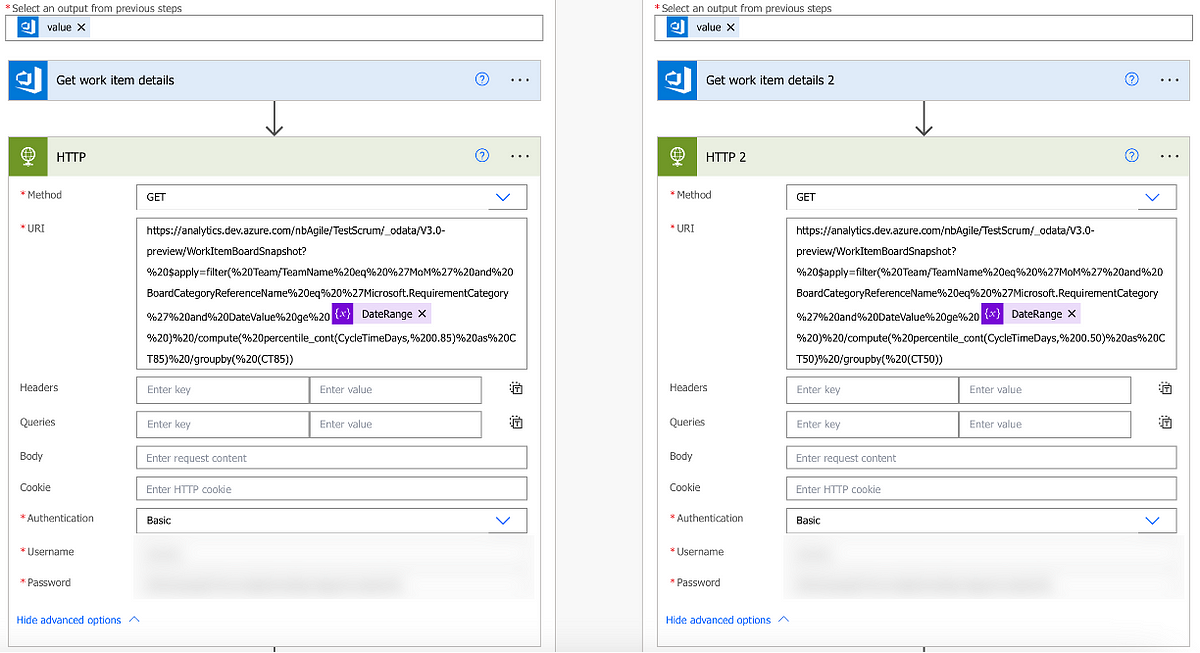
Then we do something slightly different. On the branch that is the 85th percentile you need to add the following:

%20)%20/compute(%20percentile_cont(CycleTimeDays,%200.85)%20as%20CT85)%20/groupby(%20(CT85))

For the branch that is the 50th percentile you need to add the following:

%20)%20/compute(%20percentile_cont(CycleTimeDays,%200.5)%20as%20CT50)%20/groupby(%20(CT50))

Which should then look like so:

Then click ‘Show advanced options’ for both branches and add in your PAT:

Next we are going to add in a Parse JSON step. Similar to before, this is where we are going to extract the CycleTimeDays value. For both choose ‘body’ from your previous HTTP step.

For your 85th percentile branch your schema should be:

{
    "type": "object",
    "properties": {
        "@@odata.context": {
            "type": "string"
        },
        "value": {
            "type": "array",
            "items": {
                "type": "object",
                "properties": {
                    "@@odata.id": {},
                    "CT85": {
                        "type": "number"
                    }
                },
                "required": [
                    "@@odata.id",
                    "CT85"
                ]
            }
        }
    }
}

For your 50th percentile it should be:

{
    "type": "object",
    "properties": {
        "@@odata.context": {
            "type": "string"
        },
        "value": {
            "type": "array",
            "items": {
                "type": "object",
                "properties": {
                    "@@odata.id": {},
                    "CT50": {
                        "type": "number"
                    }
                },
                "required": [
                    "@@odata.id",
                    "CT50"
                ]
            }
        }
    }
}

For our next step we are going to add an Apply to each for each branch. Before adding a step we need to add a concurrency control, which we do via clicking the three dots next to ‘Apply to each’ and then ‘Settings’:

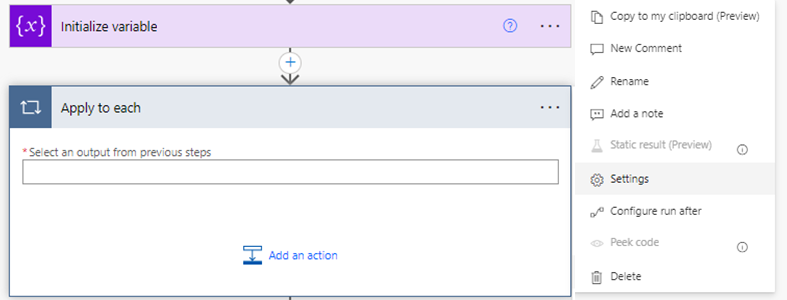
Then we want to turn Concurrency Control to ‘On’ and set our degree of parallelism to 1:

Please make sure you do this for both branches!

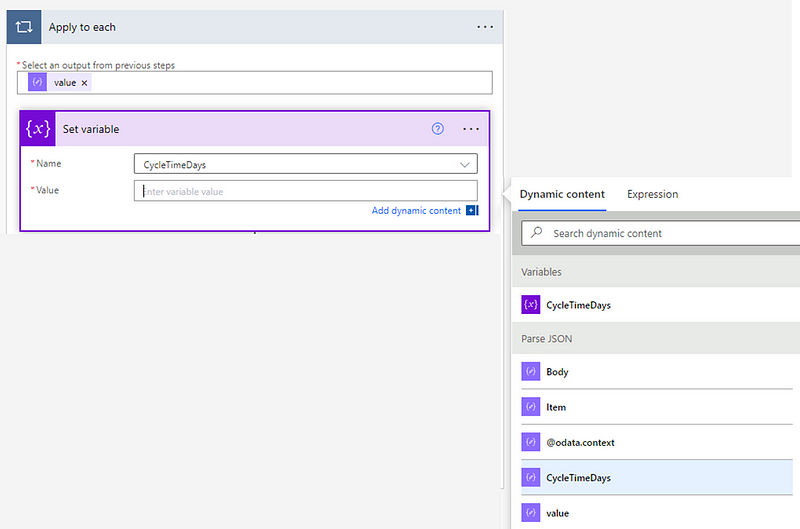
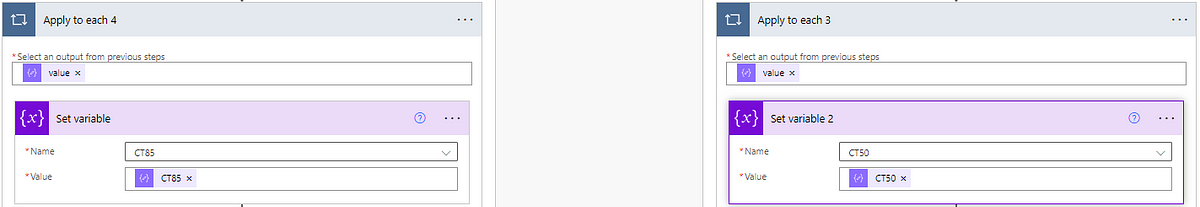
After this we can select ‘value’ from our Parse JSON step for our ‘Select an output from previous steps’ field:

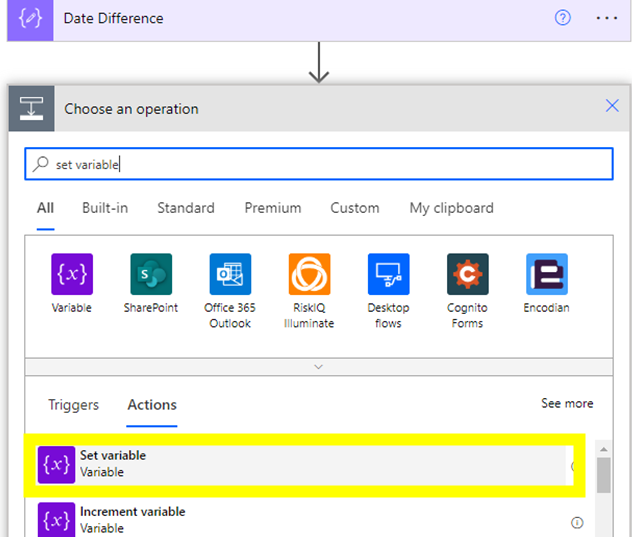
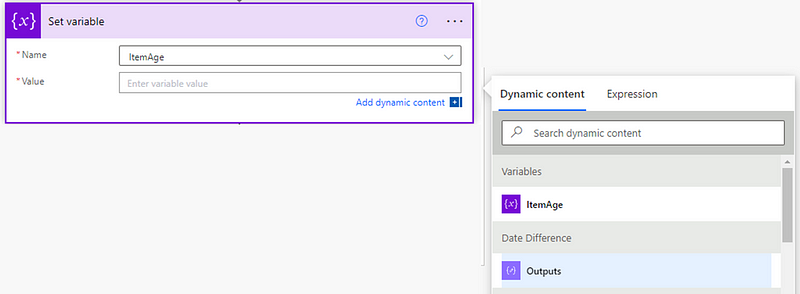
Then we are going to add a step to Set Variable which, for our respective branches, we are using dynamic content to populate the value field:

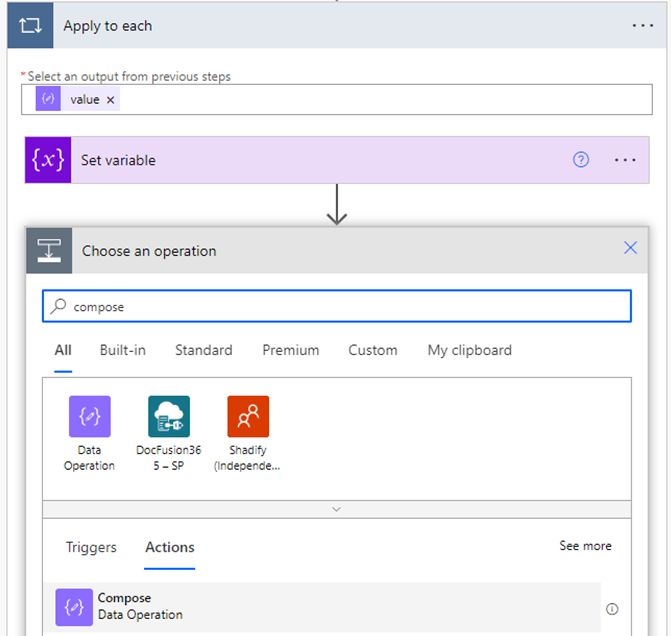
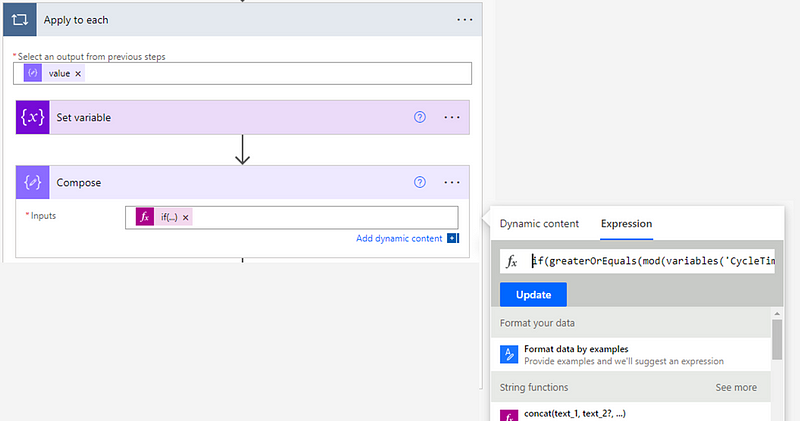
Next is a Compose step where we will use an expression. For our 85th percentile this should be:

if(greaterOrEquals(mod(variables('CT85'),1),0.5),formatNumber(variables('CT85'),'0'),if(less(mod(variables('CT85'),1),0.5),if(equals(mod(variables('CT85'),1),0),formatNumber(variables('CT85'),'0'),add(int(first(split(string(variables('CT85')),'.'))),1)),first(split(string(variables('CT85')),'.'))))

For our 50th percentile it should be:

if(greaterOrEquals(mod(variables('CT50'),1),0.5),formatNumber(variables('CT50'),'0'),if(less(mod(variables('CT50'),1),0.5),if(equals(mod(variables('CT50'),1),0),formatNumber(variables('CT50'),'0'),add(int(first(split(string(variables('CT50')),'.'))),1)),first(split(string(variables('CT50')),'.'))))

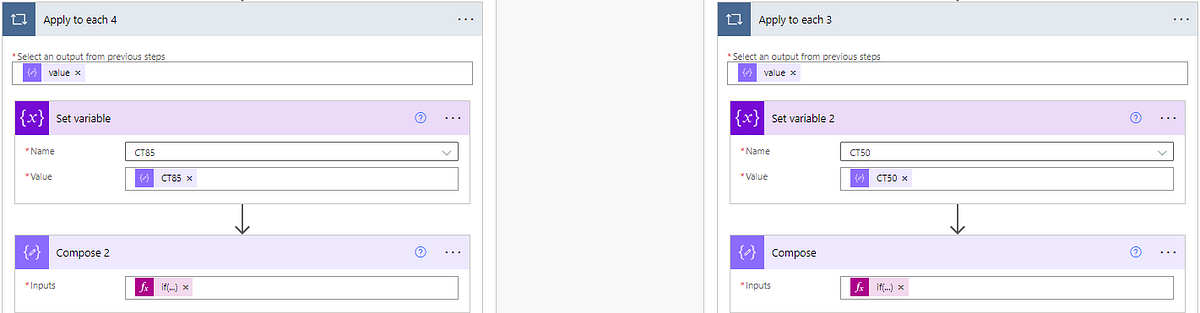
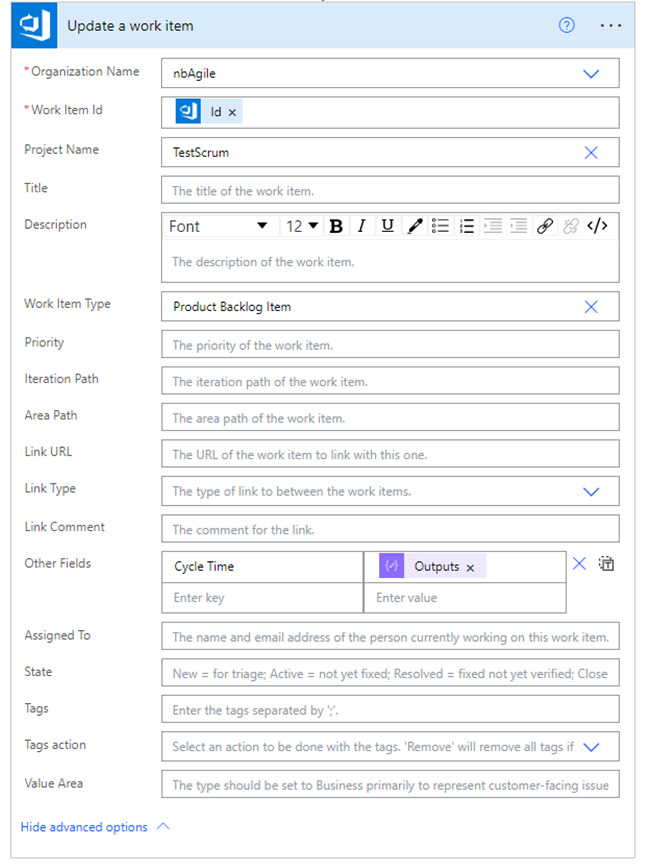
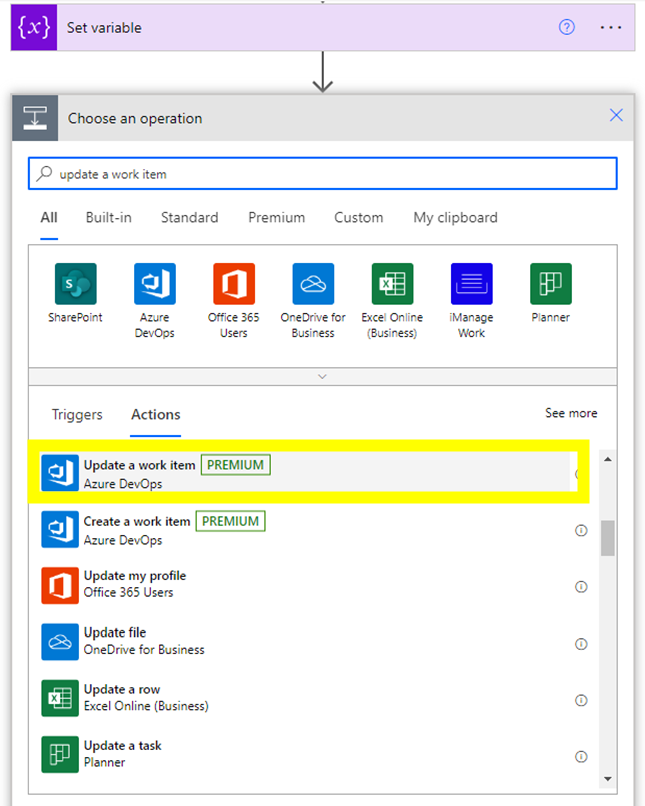
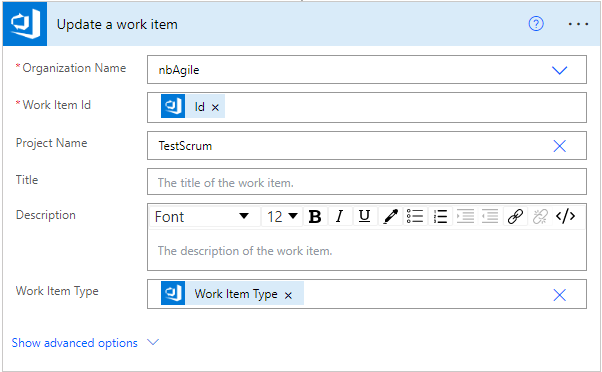
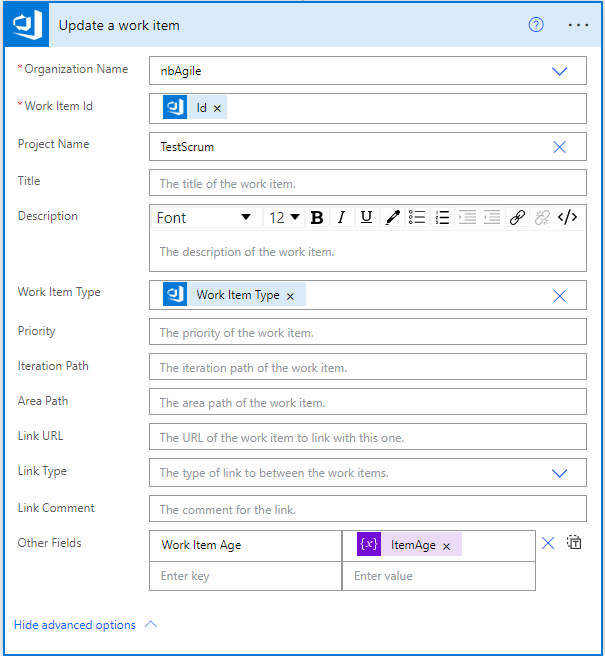
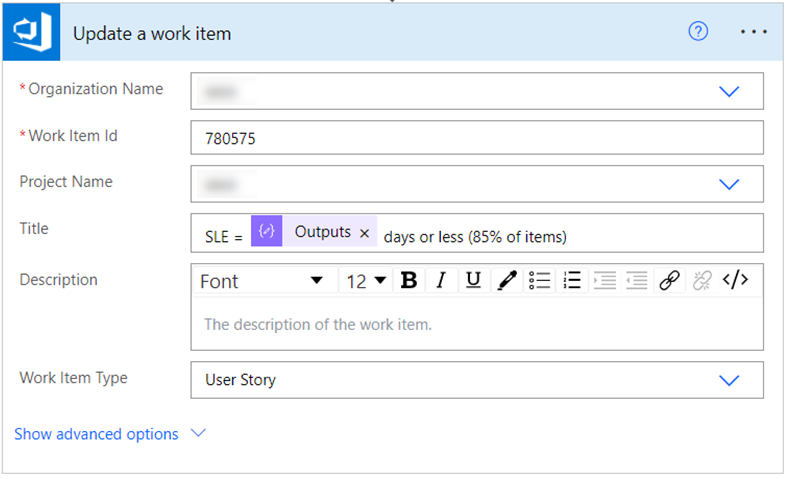
Final step for each branch is to Update a work item. This is where we are going to be adding the percentiles to the respective work item. Here we need to make sure the organization and project match what we entered previously. Our ‘Id’ and ‘Work item type’ should be dynamic content from our previous steps. Finally our respective fields for the SLE or 50th percentile should match the names we gave them at the very beginning and the values should be the ‘outputs’ of our previous Compose steps.

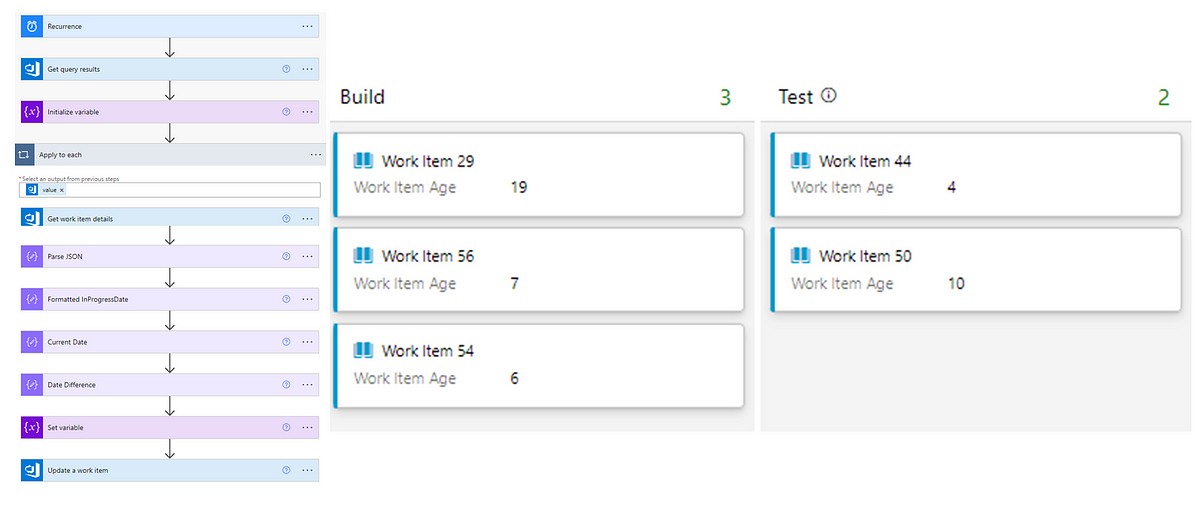
That’s the automation complete! Make sure all your step names match the above images and hit ‘Test’ to give it a test run:

Making this visible on the kanban board

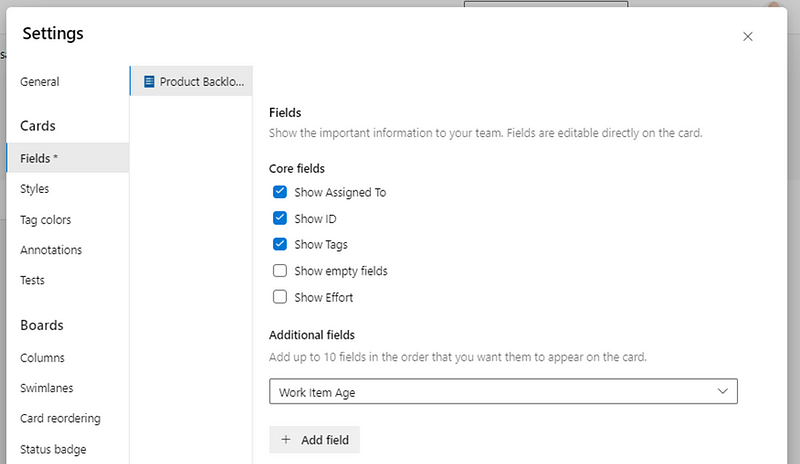
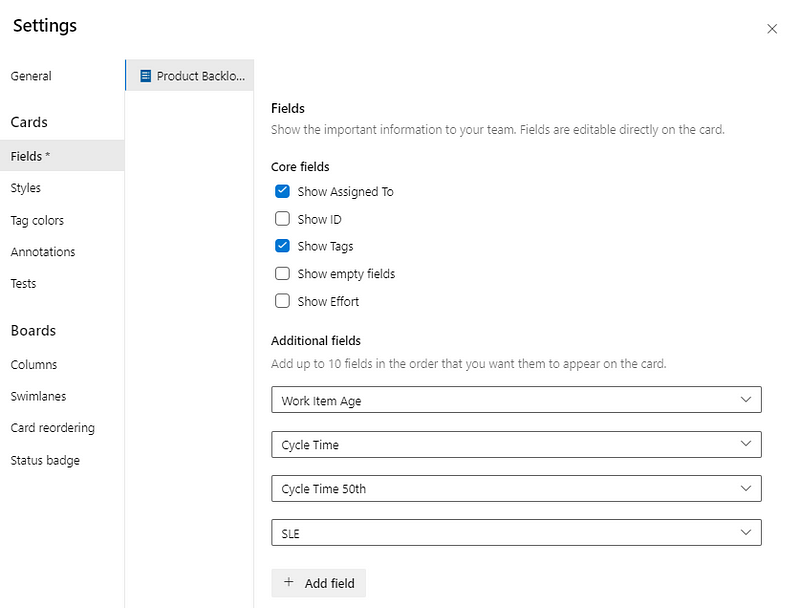
The final step is to make these fields visible on the kanban board. To do this we need to go into our board settings and find the respective work item type. Under ‘Additional fields’ you’ll want to add Cycle Time 50th and SLE:

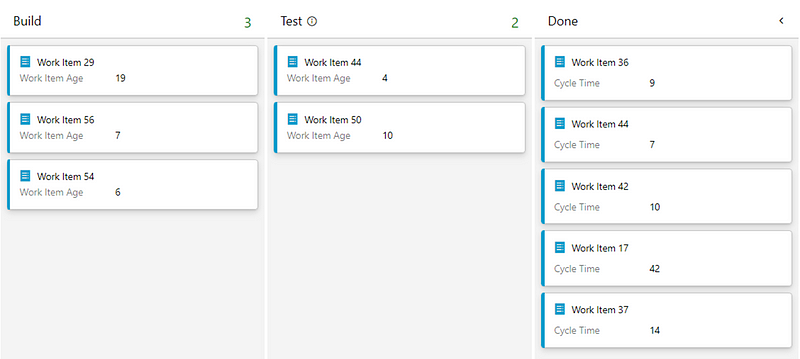
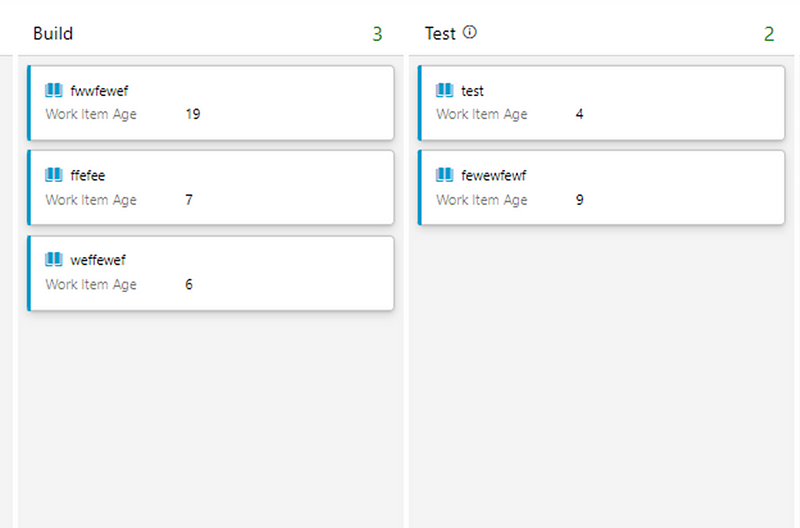
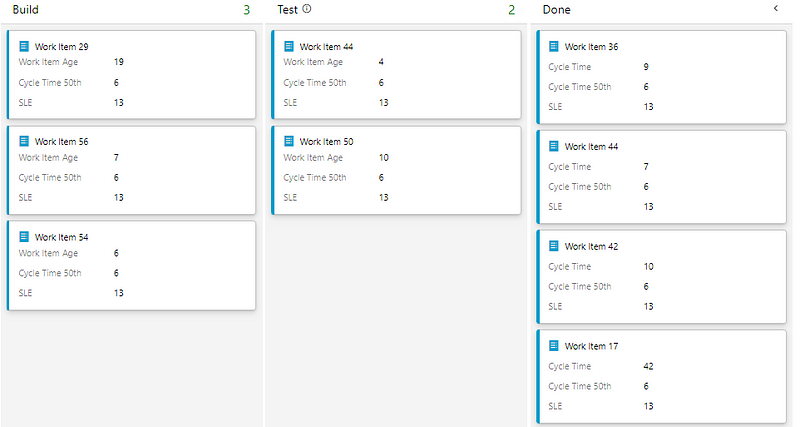
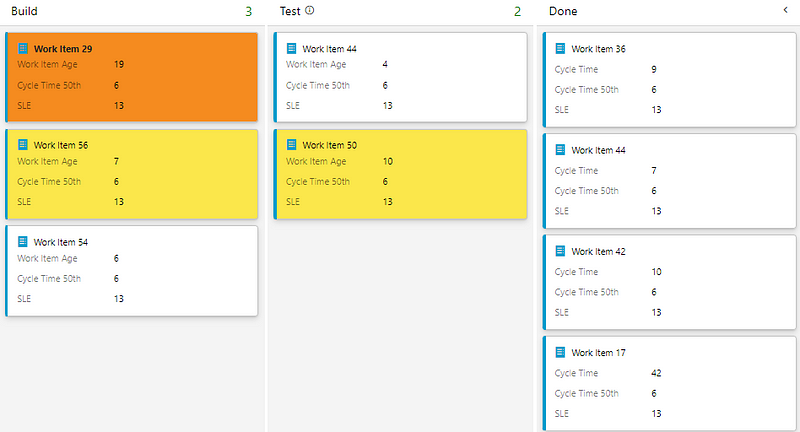
Now, we can see our Work Item Age and compares this to our 50th percentile for our cycle time as well as, more importantly, our SLE:

Taking this further…and alternative ways to display SLE

Unfortunately we cannot configure styles within the Kanban board if one field is greater than another. For example we ideally want a rule whereby if Work Item AgeCycle Time 50 then turn that item yellow and/or if Work Item AgeSLE then turn that item orange. ADO (currently) doesn’t let you do that, instead allowing just the entry of a value:

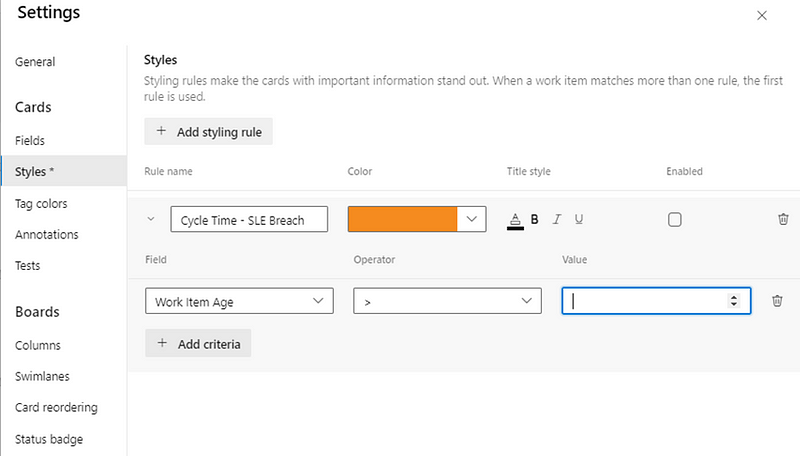
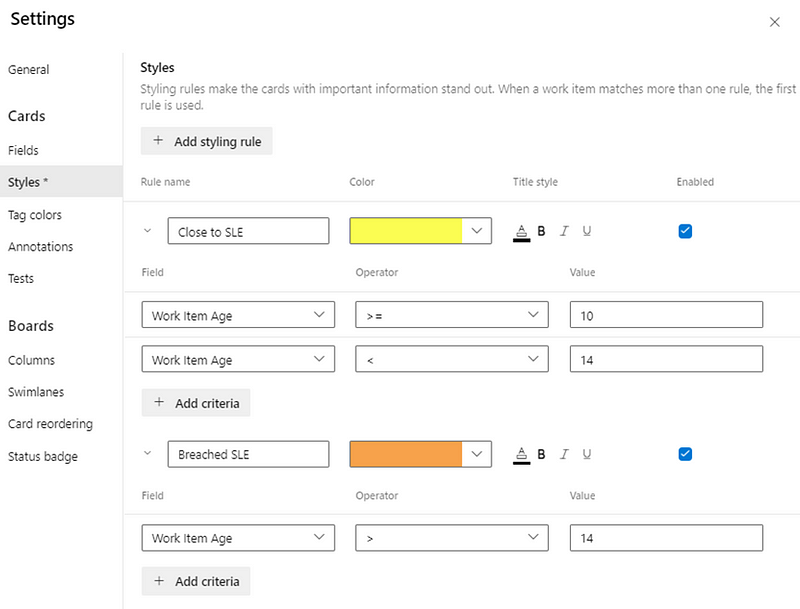
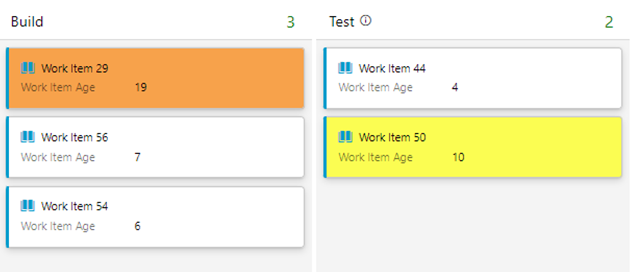
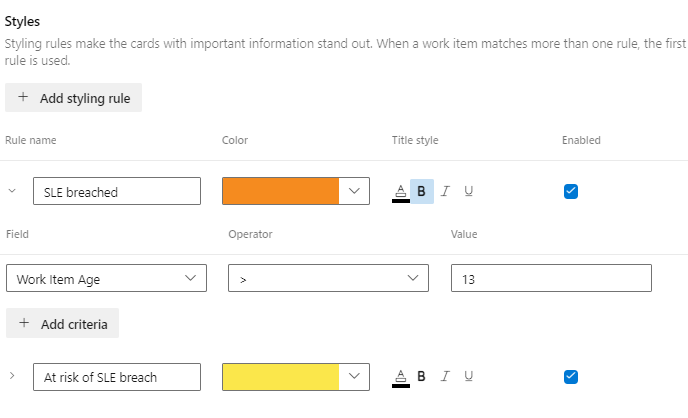
The best we can do here for now is just to use that 50th percentile and SLE information to add styling rules for at risk and/or breached items:

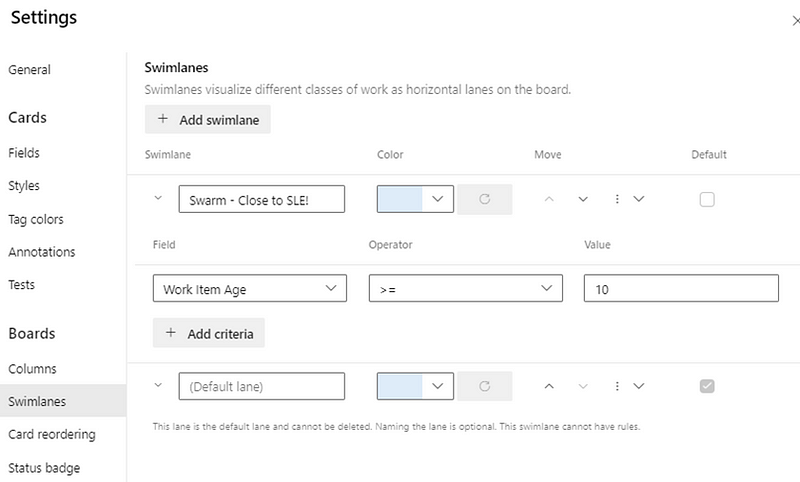
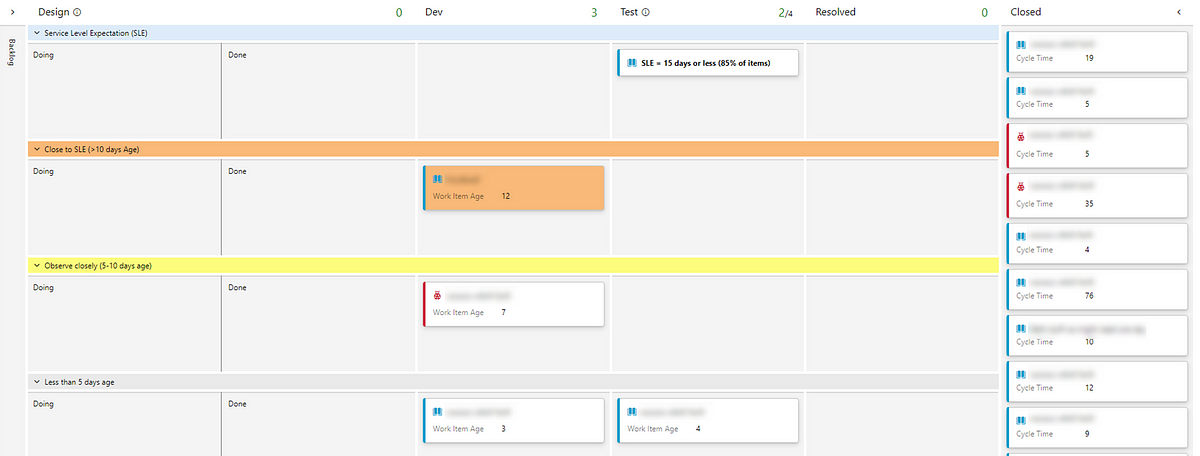
I mentioned previously about an alternative approach to making your SLE visible on your board. Another way, which may be a more controversial approach (as it directly impacts the design of the teams workflow), is to have a placeholder item on the board that will always display the current SLE. To do this, create any work item type for your board and give it any name you like (don’t worry, we are going to overwrite this). Configure a Swimlane for the top of your board called Service Level Expectation (SLE) and place this item in one of your in progress columns. Here is an example:

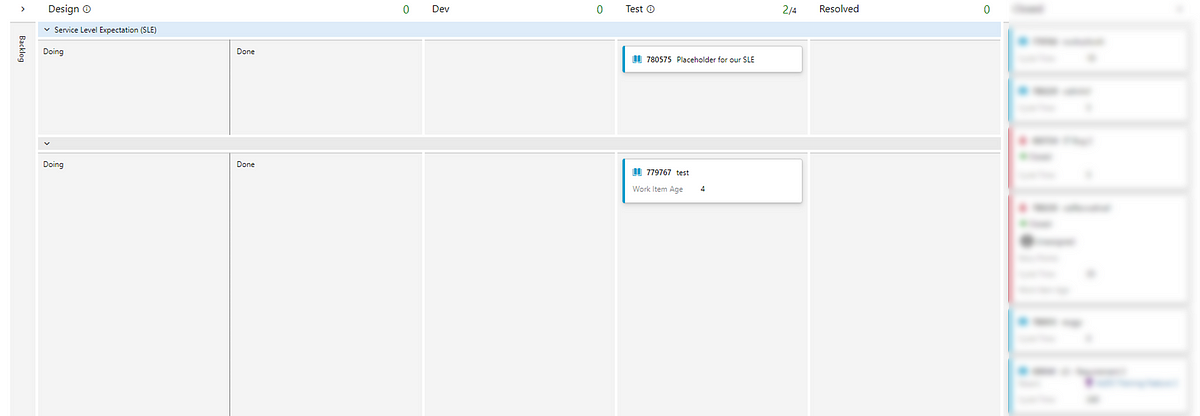
Following slightly different steps (not detailed in this post but can be shared if it’s of interest) we can do something like the following:

With the result being an item on the board that looks like so:

Similar to previous posts, having the SLE as a field on the card allows you to better highlight those items that may be close to exceeding this value.

Of course you could leverage the same styling rules approach as previously shown:

You can also take this further and define SLE’s for different work item types. For example if I wanted this to be dynamic for different work item types, I would adjust my HTTP action like so:

Hopefully this series of blogs have been helpful in making this information around the measures defined in the kanban guide more accessible for you and your teams. Don’t forgot to add a comment below for any feedback :)

Adding Cycle Time to your Azure DevOps board using Power Automate

The second in a series of three blogs covering how you can add flow metrics directly into your kanban board in Azure DevOps. Part one covered how to add Work Item Age. Part two (this blog) will cover adding Cycle Time and part three will show how to add in your Service Level Expectation…

What do we we mean by Cycle Time?

As per the Kanban Guide:

Cycle Time — the amount of elapsed time between when a work item started and when a work item finished.

The challenge we have in Azure DevOps is that despite information around cycle time being available to populate widgets such as the cycle time chart, it requires again moving away from the board to view on a separate page.

Analytics widgets — Azure DevOps | Microsoft Learn

What would be even better for teams would be getting that information real time, ideally as soon as possible after an item moves to done. Here’s how this can be made possible…

Prerequisites

Similar to the last post, here are some assumptions made in this guidance:

With all those in place — let’s get started!

Adding a ‘Cycle Time’ field to ADO

We need to add a new field into our process template in ADO called Cycle Time. You need also to know the respective work item type(s) you want to do this for. Again, for the purpose of simplicity in this blog we will stick to Product Backlog Item (PBI) as the work item type we will do this for and be using the inheritance of the Scrum process template. Please note, if you are wanting to do this for multiple work item types you will have to repeat this process.

  • Find the PBI work item type in your inherited process work items list

  • Click into it and click ‘New field’

  • Add the Cycle Time field — ensure you specify it as an ‘integer’

If you have followed the previous post and have added a custom Work Item Age field, you’ll want to also implement a work item rule here. This is so that when items that were in progress move to done, we clear the Work Item Age field. You can do this like so:

Now, before automating, let’s briefly recap on how cycle time is calculated…

Understanding how Cycle Time is calculated

From Microsoft’s own documentation, we can see that Cycle Time is calculated from when an item first enters an ‘In Progress’ state category to entering a ‘Completed’ state category.

Source:

Cycle Time and Lead Time control charts — Azure DevOps Services | Microsoft Learn

Fortunately for us, when this happens, Microsoft auto-calculates this cycle time, storing it in a column in the database/analytics views known as CycleTimeDays. As mentioned previously, is not the intent of this blog to get into a debate about adding +1 days to an item as there are no instances where an item has taken 0 days to complete.

Ultimately, calculating cycle time this way still aligns with the definition as set out in the kanban guide as it is still “the amount of elapsed time between when a work item started and when a work item finished.”

Time to move on to automation…

Automating the input of Cycle Time on items

Our automation looks slightly different this time as, rather than a scheduled automation, we want this to run any time an item moves to done. Therefore we need to pick an Automated cloud flow in Power Automate:

We are going to call it Cycle Time and our trigger is going to be When a work item is closed:

We will add in our ‘Organization Name’, ‘Project Name’ and ‘Type’. Again, for this instance we are going to be consistent and just use the Product Backlog Item (PBI) type.

Please note, if you are wanting to do this for multiple work item types you will have to repeat the process of adding this field for each work item type.

The closed state field should be auto-populated:

Next we need to add a step for a Delay:

The reason for this is sometimes the calculating of cycle time by Microsoft can be a little slow. All we are going to add in here is a 30 second delay to give enough time for the CycleTimeDays column to be populated:

Following this, we are going to add a Get work item details step:

Here we want to make sure our organization, project and work item type are consistent with our first step. We also want to add in the ‘Id’ field from our first action when a work item is closed:

After this, we want to add in a HTTP step which is where we will pull in the CycleTimeDays for the completed item:

You’ll need to set the method as ‘GET’ and add in the the URL. The first part of the URL (replace ORG and PROJECT with your details) should be:

https://analytics.dev.azure.com/ORG/PROJECT/_odata/v3.0-preview/WorkItems?$filter=WorkItemId%20eq%20

Add in the dynamic content of ‘Id’ from our Get work item details step:

After the Id, add in:

&$select=CycleTimeDays

Which should then look like:

Again, ensure you have added your PAT details in the advanced options:

PAT blurred for obvious reasons!

Next we are going to add a Parse JSON step, where we are going to extract the CycleTimeDays value:

For content you’ll want to choose ‘Body’ and add a schema like so:

{
    "type": "object",
    "properties": {
        "@@odata.context": {
            "type": "string"
        },
        "value": {
            "type": "array",
            "items": {
                "type": "object",
                "properties": {
                    "CycleTimeDays": {
                        "type": "number"
                    }
                },
                "required": [
                    "CycleTimeDays"
                ]
            }
        }
    }
}

Next we need to add an Initialize variable step:

This will serve the purpose of temporarily storing our cycle time before we write it back to the respective work item. Add in the following:

Apply to each is the next step to add in:

Here we will use the ‘value’ from our Parse JSON action as our output from previous steps:

Then we’ll need to add in a Set variable step which is essentially where we are going to pass through our CycleTimeDays in the value field:

Then we need to add a Compose step for rounding our Cycle Time:

Here we need to set an expression of:

if(greaterOrEquals(mod(variables('CycleTimeDays'),1),0.5),formatNumber(variables('CycleTimeDays'),'0'),if(less(mod(variables('CycleTimeDays'),1),0.5),if(equals(mod(variables('CycleTimeDays'),1),0),formatNumber(variables('CycleTimeDays'),'0'),add(int(first(split(string(variables('CycleTimeDays')),'.'))),1)),first(split(string(variables('CycleTimeDays')),'.'))))

The final action is to write this back to Azure DevOps. Here we want to add a step to Update a work item:

Ensure the organization, project and work item type all match our previous steps. We want to choose ‘Id’ from our Get Work Item Details action previously. Click Advanced Options and ensure that Cycle Time is populated with the outputs of our previous step:

Then hit save and the flow is created!

To test if it works, you will need to create a dummy item and move it to your closed state on your board to see if the flow works. With a successful run looking like so:

Making this visible on the kanban board

The final step is to make this visible on the kanban board. To do this we need to go into our board settings and find the respective work item type. Under ‘Additional fields’ you’ll want to add Cycle Time:

Then, when an item moves to done and the flow runs, you will then see the cycle time for your completed items:

Please note — this will not retrospectively update for items that were in a Closed/Done state before this automation was setup. You could however combine the logic of this and the previous blog post to do that :)

Ways you could take it further

Now, teams who are using the board as part of their daily sync/scrum also have the cycle time for completed items visible on the cards themselves. This provides insights around how long items actually took. You could then take this further, for example adding styling rules for any items that took longer than an agreed duration (or a Service Level Expectation — SLE).

This team may choose to do that for anything that took over 10 days:

Which could be the basis for discussing these orange items in a retrospective.

Now you have two of the four flow metrics visible for all in progress and completed items on your board, which is hopefully this is a useful next step for increasing awareness around the flow of work :)

Check out part three which covers how to automate the adding of a Service Level Expectation (SLE) to the kanban board…

Adding Work Item Age to your Azure DevOps board using Power Automate

The first in a series of three blogs covering how you can add flow metrics directly into your kanban board in Azure DevOps. Part one (this blog) will cover adding Work Item Age. Part two covers adding Cycle Time and part three will show how to add in your Service Level Expectation (SLE)…

Context

As teams increase their curiosity around their flow of work, making this information as readily available to them is paramount. Flow metrics are the clear go-to as they provide great insights around predictability, responsiveness and just how sustainable a pace a team is working at. There is however, a challenge with getting teams to frequently use them. Whilst using them in a retrospective (say looking at outliers on a cycle time scatter plot) is a common practice, it is a lot harder trying to embed this into their every day conversations. There is no doubt these charts add great value but, plenty of teams forget about them in their daily sync/scrums as they will (more often than not) be focused on sharing their Kanban board. They will focus on discussing the items on the board, rather than using a flow metrics chart or dashboard, when it comes to planning for their day. As an Agile Coach, no matter how often I show it and stress the importance of it, plenty of teams that I work with still forget about the “secret sauce” of Work Item Age in their daily sync/scrum as it sits on a different URL/tool.

Example Work Item Age chart

This got me thinking about how we might overcome this and remove a ‘barrier to entry’ around flow. Thankfully, automation tools can help. We can use tools like Power Automate, combined with other sources, to help improve the way teams work through making flow data visible…

Prerequisites

There are a few assumptions made in this series of posts:

With all those in place — let’s get started!

Adding a ‘Work Item Age’ field to ADO

We first need to add a new field into our process template in ADO called Work Item Age. You need to also know the respective work item type(s) you want to do this for. For the purpose of simplicity in this blog we will stick to Product Backlog Item (PBI) as the work item type we will set this up for and be using an inheritance of the Scrum process template.

Please note, if you are wanting to do this for multiple work item types you will have to repeat the process of adding this field for each work item type.

  • Find the Product Backlog Item type in your inherited process template work items list

  • Click into it and click ‘new field’

  • Add the Work Item Age field — ensuring you specify it as an ‘integer’ type

That’s the easy part done, now let’s tackle the trickier bits…

Understanding how Work Item Age is to be calculated

From Microsoft's own documentation, we can see that in ADO their Cycle Time calculation is from when an item first enters an ‘In Progress’ state category to entering a ‘Completed’ state category:

Source:

Cycle Time and Lead Time control charts — Azure DevOps Services | Microsoft Learn

Therefore, we can determine that for any items that have been started but not completed, the Work Item Age is calculated as the difference, in calendar days, between the current date and the time when an item first entered the ‘In Progress’ state category, also known as the InProgressDate.

It is not the intent of this blog to get into a debate about adding +1 days to an item as there are no instances where an item has taken 0 days to complete — for that we have Drunk Agile ;)

Ultimately, calculating Work Item Age this way still aligns with the definition as set out in the kanban guide as it is still “the amount of elapsed time between when a work item started and the current time.”

Now let’s jump into the automation…

Automating Work Item Age

We start by creating a query in ADO of all our current ‘in progress’ items. The complexity of this will of course vary depending on your ADO setup. For this we are keeping it simple — any PBI’s in our single ‘In Progress’ state of Committed:

Please ensure that Work Item Age is added as one of your columns in your query. It needs to be saved as a shared query and with a memorable title (sometimes I like to add DO NOT EDIT in the title).

Next we go to Power Automate and we create a Scheduled cloud flow:

We are going to call this ‘Work Item Age’ and we will want this to run every day at a time that is before a teams daily sync/scrum (e.g. 8am).

Once you’re happy with the time click create:

Next we need to click ‘+ new step’ and add an action to Get query results from the query we just set up:

Please ensure that you input the relevant ‘Organization Name’ and ‘Project Name’ where you have created the query:

Following this we are going to add a step to Initialize variable — this is essentially where we will ‘store’ what our Work Item Age is which, to start with, will be an integer with a value of 0:

Then we are going to add an Apply to each step:

We’ll select the ‘value’ from our ‘Get query results’ step as the starting point:

Then we’ll add a Get work item details step. Here we need to make sure the ‘Organization’ and ‘Project’ match what we set out at the beginning.

For Work Item Type we need to choose ‘Enter Custom Value’:

We can then choose ‘Work Item Type’ and ‘ID’ as dynamic content from our ‘Get query results’ step previously:

With the end result being:

Next we need to add a HTTP step. This is essentially where we are going to get the InProgressDate for our items:

You’ll need to set the method as ‘GET’ and add in the the URL. The first part of the URL (replace ORG and PROJECT with your details) should be:

https://analytics.dev.azure.com/ORG/PROJECT/_odata/v3.0-preview/WorkItems?$filter=WorkItemId%20eq%20

Add in the dynamic content of ‘Id’ from our Get work item details step:

After the Id, add in:

&$select=InProgressDate

Which should look like:

You’ll then need to click ‘Show advanced options’ to add in your PAT details. Set the authentication to ‘Basic’, add in a username of ‘dummy’ and paste your PAT into the password field:

PAT blurred for obvious reasons!

Then we need to add in a Parse JSON step:

This is where we are essentially going to extract our InProgressDate

Choose ‘body’ as the content and add a schema like so:

{
    "type": "object",
    "properties": {
        "@@odata.context": {
            "type": "string"
        },
        "value": {
            "type": "array",
            "items": {
                "type": "object",
                "properties": {
                    "InProgressDate": {
                        "type": "string"
                    }
                },
                "required": [
                    "InProgressDate"
                ]
            }
        }
    }
}

Then we need to format this how we want so it’s easier to do the date difference calculation. Add a Compose step:

Rename this to be Formatted InProgressDate and with the following as an expression:

formatDateTime(body('Parse_JSON')?['value'][0]['InProgressDate'], 'yyyy-MM-dd')

Then add another Compose step, this time to get the Current Date, which should be an expression like so:

formatDateTime(utcNow(), 'yyyy-MM-ddTHH:mm:ssZ')

Then we will add one more Compose step to calculate the Date Difference, which is the following expression:

div(sub(ticks(outputs('Current_Date')), ticks(outputs('Formatted_InProgressDate'))), 864000000000)

This is essentially doing a (rather long-winded!) date difference calculation. This appears to be the only way to do this type of calculation in Power Automate.

Then we need to add a step to Set variable, which was something we established earlier on to store the work item age:

Here we just need to choose the same variable name (ItemAge) and use the ‘outputs’ from the previous step (Date Difference) as the dynamic content:

Final step is to populate this on the respective work item in ADO. To do this, search for an Update a work item step:

Then you will want to populate it with the ‘organization name’ and ‘project’ you’ve been using throughout. You also need to ensure you add in ‘Id’ for the Work Item Id and ‘Work Item Type’ from your steps previous:

Then you need to click ‘Show advanced options’ and add ‘Work Item Age’ into other fields and choose ‘ItemAge’ as the value:

Then hit save and the flow is created (ensure all your step names match the below):

Then it’s best to do a test run, which you can do by clicking Test, select ‘Manually’ and then click Test > Run Flow:

Clicking ‘Done’ will take you to a page that will show you if steps have been successful and which are in progress:

You can also view the ‘Run history’ to see if it is successful. Please note the amount of in progress items will impact how long the flow takes:

Once run, if you check back into Azure DevOps and your query, you should now see your Work Item Age field populated:

Making this visible on the Kanban board

The final step is to make this visible on the Kanban board. To do this we need to go into our board settings and find the respective work item type. Under ‘Additional fields’ you’ll want to add Work Item Age:

Then, when your board refreshes, you will see the Work Item Age for your ‘In Progress’ items:

Ways you could take it further

Now, teams who are using the board as part of their daily sync/scrum also have the age of work items visible on the cards themselves. This allows them to make informed decisions about their plan for the day, without having to flip between different tools/links to view any charts.

You can then take this further, for example adding styling rules for when items go past a particular age:

Similarly, you could also leverage the swimlane rules functionality that was recently released and create a swimlane for items a team should be considering swarming on. This could be where items are close to exceeding a teams’ forecasted cycle time or Service Level Expectation (SLE):

Hopefully this is a useful starting point for increasing awareness of Work Item Age on the board for a team.

Check out part two which details how to automate the adding of Cycle Time to the work item form for completed items…